Показаны сообщения с ярлыком strategy maps. Показать все сообщения

пятница, 10 февраля 2023 г.

How to Create a Balanced Scorecard: Nine Steps to Success™


BSI’s award-winning framework for strategic planning and management, Nine Steps to Success™, is a disciplined, practical, and tested approach to developing a strategic planning and management system based on the balanced scorecard. It gives organizations a way to ‘connect the dots’ between the various components of strategic planning, budgeting, operations and management; meaning there will be a visible connection between day-to-day operations, the measurements being used to track success, the strategic objectives the organization is trying to accomplish, and the mission, vision and strategy of the organization.

This approach is more about engaging hearts and minds to transform an organization to higher performance than it is about just measuring performance. Ultimately, managers and executives can use the BSI-developed scorecard system to help define strategy, rally the organization around that strategy and achieve what the organization wants to achieve.

The Nine Steps to Success™ Program Plan

Below details each step of the Nine Steps to Success™ framework.

Program Launch

The program is launched by project champion(s) and key stakeholders (working on their own or with BSI consultants). Existing strategic material and results are examined, a strategic gap analysis is completed, key stakeholders are interviewed, and other assessment activities are completed to customize workshops to incorporate work done to date.

Step 1: Assessment

It is critical that before an organization maps out its future there is some consensus around where things currently stand. During the Assessment step, an analysis of the current internal and external environments is completed. As part of this step, organization develops or re-validates high-level strategic elements (e.g., mission, vision, values, market assessments, enablers & challenges, primary and secondary customer / stakeholder needs analysis and others) needed for context in strategy formulation.

Step 2: Strategy

Building on the assessment, organizations formulate/clarify strategy in the Strategy step. The development of the strategy includes developing or clarifying your customer value proposition, visualizing strategy using a Strategy Profile and decomposing the high-level strategic direction into three to four Strategic Themes (or goals). Strategic Themes are those focus areas in which the organization must excel in order to fulfill its mission and achieve its vision, given the enablers it can leverage, the challenges it must overcome, and the customer value proposition it must deliver upon.

Additionally, organizations are viewed, internally and externally, though lenses, or Perspectives which frame the organization as a system of defined elements and capabilities that work together. One of the signature components of the original Balanced Scorecard, the names of the four perspectives will vary slightly (depending on the type of organization) from the original design: Financial, Customer/Stakeholder, Internal Process and Organizational Capacity (or Learning and Growth). The perspectives work together in a series of cause and effect (or drivers and results), creating value from the internal to the external. When combined, the Strategic Themes and Perspectives frame and define an integrated strategy.


Step 3: Strategic Objectives

In the Strategic Objectives step, the building blocks of strategy are developed. Strategic Objectives are the linchpins of a successful strategic planning and management system and are the key to implementing strategy. Objectives are qualitative, continuous improvement actions (outcomes) critical to strategy success. Objectives are developed on the strategic theme level first and then merged together to form organization-level Objectives.

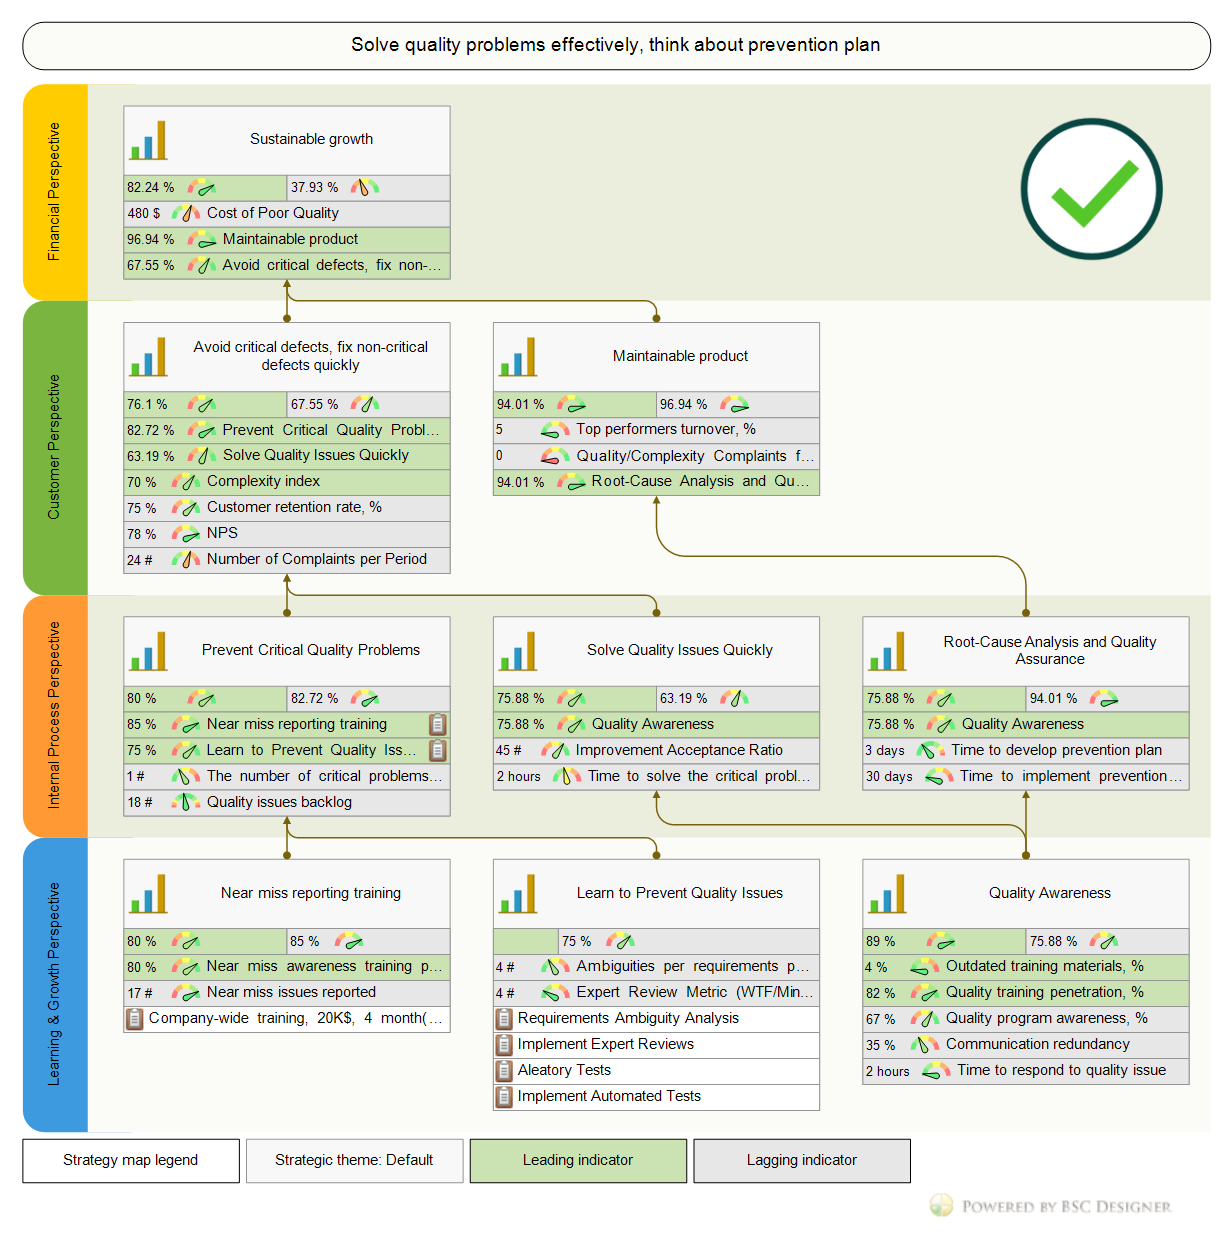
Step 4: Strategy Mapping

In the Strategy Mapping step, cause-and-effect links are developed between the Strategic Objectives, creating a “value chain” of how customers and stakeholders are satisfied by the organization’s products and services. Strategy Maps are developed for each theme to ensure a complete strategy to achieve each strategic result and then those are merged into a final organizational Strategy Map. A Strategy Map is a graphic that shows the cause-and-effect relationships of objectives across the four perspectives, telling the story of how the organization will achieve the results desired.


Step 5: Performance Measures

Performance Measures (KPIs) are critical to tracking progress of an organization’s strategy. The image below shows the inter-connectivity relationships among different types of performance measures. Operational measures focus on the use of resources, processes and production (output). These measures “drive” the outcomes a business desires, with some outcomes being more intermediate than other, more final, outcomes. Our process gets at these relationships, so you can identify the most meaningful outcome measures to determine if your actions are leading to the strategic results you desire.


Performance measures are developed for each of the objectives on the strategy map. The emphasis in this step is on helping you develop the critical leading and lagging measures needed to manage strategy execution.

Step 6: Strategic Initiatives

In the Strategic Initiatives step, the projects that are critical to success of the strategy, are developed, prioritized, and implemented. Initiatives help close performance gaps in performance to hit targets. It is important to focus the organization on the execution of the most prioritized strategic projects versus creating a long list of potential actions and projects. Without this disciplined focus, organizations struggle to execute their strategy.

Scorecard Rollout: Integrating Steps 1 through 6

Once Step 6 is complete, the organization-level scorecard system is ready to be rolled out to employees. The goal of this part of the process is to create more internal fans and build a coalition of employees to start thinking more strategically and using the system to better inform decision making. The Balanced Scorecard Graphic, shown below, is a key deliverable and brings all the strategic elements of strategy formulation and planning together in one simple to understand graphic that becomes the heart of the process of communicating the organization’s strategy to all employees. It’s a one-page document that tells the value creation story by summarizing the organization’s strategy in a simple, easy-to-use format.


Step 7: Performance Analysis

In the Performance Analysis step, data is transformed into evidence-based knowledge and understanding. Effective analysis helps people make better decisions that will drive improved strategic outcomes. This step focuses on measuring and evaluating performance to identify what works well and what doesn’t, taking corrective action and becoming a high-performance organization.

Step 8: Alignment

In the Alignment step, strategy is transformed from something only executives worry about to something everyone supports by cascading high-level enterprise strategy to first business and support units and then to individual employees. The Alignment step produces scorecards for business and support units, and individual scorecards for each employee or team.

Cascading communicates how organization level strategy (Tier 1) is supported by department/unit strategy (Tier 2), and then ultimately how employees or teams (Tier 3) contributes to the strategy with specific actions, projects and tasks.


Step 9: Evaluation

Evaluation is an opportunity to review and refresh. During this step, leaders and mangers evaluate how well the organization has accomplished desired results and how well the strategic management system improves communications, alignment and performance. It ensures that the strategic planning and management system is dynamic and incorporates continuous improvement into day-to-day operations and management.


https://cutt.ly/Q3z1Od1

суббота, 3 декабря 2022 г.

Customer Lifecycle Map

 ROUNDMAP™ is covering three structural levels: (1) Business Strategy, (2) Strategy Execution, and (3) Performance. In the figure below you can see how these three levels are arranged in the system.

10.1 - LAYOUT OF THE SYSTEM

At first glance the ROUNDMAP might look overly complex, not allowing you to see the forest for the trees which can be discouraging. However, you’ll need to perceive it as a three-in-one mapping system. If we unbundle the system you’ll see it is composed of the business strategy (strategy line), strategy execution (operating line), and performance (customer line).


10.2 - INTERTWINED

Obviously, the aspects of each of these layers, Strategy, Execution, and Performance, are to a large extend interrelated and interdepedent: it makes no sense to drive Customer Performance without being acutely aware of related matters such as the firm’s Vision, Mission, Goals and Objectives, Business Strategy, Competitive Advantages, or Customer Expectations. Everything is connected in a series of loops.

10.3 - REVISIT THE ROUNDMAP

We believe you are now ready to have look at the ROUNDMAP™ canvas. One final remark: we’ve designed the layout as a hub-and-spoke, with the value hub in the middle while the spokes represent the 8 stages that customers typically go through ─ in any order they see fit.

"If we allow that we live in times of unusual upheaval, then there are almost no certainties but this: that most people don’t like changing their minds. After committing to a narrative about something or someone, most of us will do anything to avoid having to revisit it."

~ Emma Brockes, The Guardian


https://bit.ly/3wM9OTS


четверг, 8 июля 2021 г.

Strategy Map: How-To Guide, PDF Template, and Examples

 The term strategy map has its origin in the Balanced Scorecard (BSC) concept of the mid-1990s.  Since then, strategy map became a buzzword, a synonym of any visual representation of strategy. Below, we’ll discuss the most popular approach to strategy map design based on the original K&N Balanced Scorecard.


Why Use a Strategy Map

A classical geographical map represents abstraction of the world around us. Instead of dealing with trees, rivers, and roads on the map, we deal with areas of different colors and lines. In the same way, a strategy map is abstraction of business and its strategy. This abstraction helps to focus on what’s important now.

The main purpose of a strategy map is to visualize the strategy of an organization in a specific way. In its turn, the visualization improves strategy discussion and execution.

If you ask me why you need a strategy map, I would mention these three reasons one after the other:

  • Visualization -> Discussion -> Execution

How to Create a Strategy Map

A strategy map concept comes from the K&N Balanced Scorecard. Here are key steps to creating a professional strategy map:

Step 1. Define Mission, Vision, Values

That’s the direction to the “north” for your organization. If you face uncertainty, these three will help you to make the best decisions.

Step 2. Define Four Perspectives

Finance, Customers, Internal, Innovations. You can confirm experimentally that your organization needs exactly these four. Non-profit organizations have their nuances, but the general idea is similar.

Step 3. Strategic Priorities

Strategic priorities are the top-level goals; normally, you have three main goals – serving clients better, improving operations, improving product.

Step 4. Define Business Goals

Fill in the perspectives of the strategy map with strategic business goals. There should be a cause-and-effect connection between the goals. The logic goes from top to bottom, and goals from lower perspectives explain how you plan to achieve the goals from higher perspectives.

Step 5. Describe Rationale

Rationale is a set of reasons why you decided to pick this very goal. If you use automation software, explain these reasons in the description field of the goal.

Step 6. Define Leading and Lagging Metrics

What do you mean by a business goal? The best way to answer this question is to define a pair of leading and lagging metrics with baseline and target values. Any vague goal definition becomes a specific one once performance metrics are defined.

Step 7. Define Initiatives

We mentioned “execution” as one of the purposes of the strategy map. Initiatives are your high-level action plans that explain how the strategy will be executed.

Step 8. Cascade

There should only be one top level strategy of the organization, still different business units need to focus on different parts of that strategy. Create local versions of the strategy maps with more specific goals and indicators.


Typical Mistakes of Strategy Mapping

As part of our Strategy Execution Training, we work with business professionals to create a prototype of their Balanced Scorecard strategy maps. Here are some typical mistakes that we see:

Mistake 1. Goals without Connections

The idea of the map is to show the cause-and-effect logic. If there is a goal without a connection to other goals (unless the connection is obvious), then the question is why we have that goal on the map.

Mistake 2. Focusing on Operational Goals

As mentioned before, the strategy map goals should be strategic ones. I’ve seen many cases where good strategic goals are linked to short-term binary goals like, for example, move a website to a different hosting platform.

Mistake 3. No Rationale

The choice of the goals is important; the reason for that choice is even more important. In many cases, these reasons are not explicitly described. As a result, during the next review of the strategy, it’s hard to understand why a certain goal exists on the map.

Mistake 4. Using Lagging Metrics Only

Lagging metrics help us to validate the achievement of the goal but don’t give a clue to how exactly to achieve them. Leading metrics quantify the success factors and give an answer to that question.

Mistake 5. Having a Top-Level Map Only

A top-level map won’t make a lot of sense for, let’s say, a marketing specialist who does a social media campaign. Top-level strategy needs to be aligned with the challenges of lower levels. Having a local version of a strategy map is a good idea.

Mistake 6. Having Too Many Goals

In my opinion, having more than 8-10 goals in each perspective is a red flag and a sign that the strategy was not properly cascaded. It’s like a to-do list – a list of 5-10 things works better than one of 100+ items.

Mistake 7. Mixing Goals and Metrics

“Increase sales by 15% within a year” sounds like a S.M.A.R.T. goal, but actually, it is not the best candidate for a strategy map. It’s a mix of a goal, metric, and a time frame. It won’t work for a strategy map. On step 1 of KPI template, we discussed the reasons and the solutions.

Mistake 8. Using Business Jargon

Goals like “Leverage business opportunities to satisfy customer demand” sound smart but don’t add any value to the discussion around strategy.

Strategy Map Template

I like the way BSC Designer software deals with strategy maps, but sometimes, it is worth using pen and paper for the brainstorming sessions. We do this on some of our live events, and I’d like to share with you a strategy map template that we use.


Getting Started Instructions

A strategy map template includes four perspectives. The rectangles inside the perspectives represent business goals.

A business goal includes several lines to fill in:

  • Use the first line to formulate the name of the goal.
  • Use the two lines with the “clipboard” icon to write down some initiatives and some relevant budget or timing information.
  • Use the first “KPI” line to write down leading KPIs for this business goal.
  • Use the second “KPI” line to write down lagging KPIs for the business goal.

Once you’ve sorted out the ideas about your strategy, go ahead and automate goals, initiatives, and KPIs with the BSC Designer tool.


Strategy Map Examples

Find below some examples of the strategy maps created with BSC Designer Online. You can sign-up with a free account and get immediate access to those templates.


A typical paper-version Balanced Scorecard designed by strategy consultants

Learning from Tesco Strategy Map and Scorecard

Также доступно на русском языке

A great lesson of how Balanced Scorecard works can be learned from global retailer Tesco. This company is known for its state of art Business Intelligence (BI) system. Balanced Scorecard is published yearly on tescoplc.com as part of Tesco’s BI system and is a must-see business performance tool. It even has its own name, “steering wheel.”


It is not classical BSC

If you ever start discussions about BSC or what BSC is, you’ll end up with some expert saying that BSC is not what you have in your company because you don’t have some important component. As was discussed before, there is no fixed recipe for the BSC.

Companies use this framework and modify it according to their needs. What is more important is that the company sees the improvement in business performance.

Tesco did the same trick. Taking a classical Balanced Scorecard as a framework method and adopting it to the needs of the company.


Let’s have a quick look at what was modified and what is missing:

  • In the very beginning, it is stated that there are five perspectives: community, operations, people, finance, customer. Remember that classical Balanced Scorecard suggests four perspectives that are a little bit different.
  • Another difference from the classical BSC is that strategy map is not included. If you’re checking the BSC on Tesco’s website, it is not possible to learn what strategic objectives the company has and how it is going to achieve them. Obviously, that strategy map just was not published here, and one can find a so-called “7 part” strategy of Tesco with strategic objectives and target measures. Check out this strategy map guide if you want to learn more about strategy maps.
  • Finally, as we know in classical BSC, any business objective should be aligned to KPI and action plan. It is easy to see that the publicly available BSC of Tesco does not contain all the details, such as an action plan, but comments tell us what the general vector of the company is and for sure make more sense for employees.

Let’s continue the review and find best practices that one can adopt in his own business.

From my viewpoint, one of the most important innovations is that the Balanced Scorecard (well, at least some significant part of it) is publicly available. It makes sense for company employees, it makes sense for partners and clients. I believe publishing BSC online in public access is the best way to declare that BSC is important for your company, and you are using it for performance management.

Achievement marks

Now, let’s pay attention to the marks used in the BSC. Achieved or unachieved targets are marked with a tick or a cross that gives a quick picture of what is doing well and what needs to be improved.


Also, a minor feature, but I think it is really nice – when the first value is introduced for 2008, it is not marked with tick or cross, it just said that it is “new.”

Conclusions

  • It is not 100% classical BSC
  • Strategy map with objectives is available apart from BSC
  • It is published online
  • Simple marks are used to display current state and progress

Sustainable Strategy Map Template


Quality Strategy Map Template


Training Strategy Template


Talent Strategy Map


Social Media Strategy Map Example


Strategy Map for Innovations


Education Organization Strategy Map


Strategy Map for a Startup


Hotel Strategy Map Example


Energy Company Strategy Map


Automation: Drawing Software vs. Strategy Execution Software

Talking about software automation, there are two types of software solutions for the strategy maps design. Let’s call them:

  • Drawing tools. That helps to create a nice-looking picture of a strategy map.
  • Strategy execution software. Besides creating a visual picture, these tools provide additional automation for KPIs, initiatives, and business goals.

What should you use?

If you are on the prototype stage, or you need a strategy map to simply show it once at the board meeting, then you will be perfectly fine with any drawing tool. Additional information, such as rationale, metrics and their data, action plans, can be presented as a separate document.

Key Takeaways

  • A strategy map is a visual tool that helps with the organization’s strategy on different stages: strategy discussion, description, execution, learning loop.
  • We discussed 8 steps that one can follow to create a professional strategy map, as well as typical mistakes that business professional make.
  • Choose an appropriate tool for strategy map design: paper template for initial brainstorming, drawing software for presentation, software tools like BSC Designer if you plan to get back to the map during strategy execution.

https://bit.ly/3AFT9SR