суббота, 11 июля 2020 г.

TikTok для бизнеса: эффективный инструмент или бесполезная игрушка


TikTok набирает невероятную популярность среди поколения Z: молодая аудитория проводит там ежедневно от 30 минут до нескольких часов. Кто-то считает, что эта площадка несерьезная, а кто-то видит в ней потенциал для продаж и качественный маркетинговый инструмент. 
Попробуем разобраться в этом вопросе вместе.


Как работает лента TikTok

Многие социальные сети проходят долгий путь от хронологической выдачи постов до собственных алгоритмов демонстрации публикаций пользователям. TikTok сразу перешел к рекомендованному контенту. В чем его особенности:
  • Персонализированная лента. Вам покажут те видео, которые максимально соответствуют проявленным интересам. 
  • Динамическая выдача. Результаты поиска будут зависеть от вашего поведения, времени, которое вы проводите в приложении и типа контента, который просматриваете. 
  • Разнообразие результатов. Независимо от интересов, периодически вам будут демонстрировать видео из других тематик, которые потенциально могут представлять для вас интерес. 
  • Из субъективных наблюдений. TikTok вовлекает, и если сначала может быть сложно провести там и 15 минут, то очень быстро вас «затянет»: вам начнут показывать все более релевантные и интересные видео — оторваться будет сложно. 
Если вы подумываете о том, чтобы завести канал, то рекомендуем исследовать площадку тщательно: посмотрите, как продвигаются бренды и блогеры, какой контент они генерируют и в каких жанрах работают.  

Возможности и функции


Основная задача платформы — создавать интересные видео. Возможностей немало, ниже только некоторые из них:
  • Эффекты
  • Дополненная реальность
  • Микс
  • AR-маски
  • Дуэты
  • Реакции

Популярные жанры

Для того, чтобы ваш контент смотрелся действительно уместно, важно понимать, какие форматы пользуются наибольшим спросом на площадке. Многие генерируют видео наощупь и каждый раз не знают, наберет ли оно достойное количество взаимодействий. На что стоит обратить внимание:
  • Комедийные видео. Один из наиболее ярких и вирусных жанров. Вайны, шутки и приколы из жизни — это то, что заставляет аудиторию улыбаться, делать репосты, присылать видео друзьям и так далее. Частенько на других площадках создаются целые каналы-агрегаторы интересных TikTok-видео. Наверняка вы видели такие страницы в Instagram, Telegram и на других площадках.
  • Влоги. Настоящая жизнь, как оказалось, интересует достаточно широкую аудиторию. Честный lifestyle, искренние разговоры, будни команды, закулисье брендов — все это «очеловечивает» бизнес, делает его более привлекательным для таргет-группы, особенно, если ее ядро — молодежь от 18 до 25 лет. 
  • Красота, талант и спорт. Танцевальная студия может продвигать TikTok через преподавателей, фитнес-клуб — с помощью подтянутых тренеров. Самовыражение привлекает подписчиков: сеты упражнений, талантливые вокальные номера, танцевальные связки, процесс отрисовки макетов в гиперлапсе, создание яркого макияжа или укладки… В любой нише можно найти подходящий контент: процесс создания продукта, краш-тесты, «до-после» и многое другое. 
  • Мода. Обзоры новинок, подиумных показов, советы по подбору и сочетанию вещей, тенденции и «модные “да/нет”» — это привлекает миллионы просмотров. 
  • «Видео с котиками». Все, что связано с питомцами «заходит на ура» в публичном пространстве, и это ни для кого не секрет. Поэтому если у вас в офисе живет милый кот, вы можете завести для него канал.  
  • Lipsing. Очень популярный жанр: включаете песню и делаете вид, что поете. Как ни странно, этот рецепт работает — такие каналы набирают немало просмотров, лайков, комментариев и подписчиков. 

Хештег-челлендж


UGC (User generated content) — контент, который создает аудитория компании. Например, с помощью своих видео можно стимулировать таргет-группу создавать собственные видео, оставлять комментарии, делать фото и т.д. Зайдите на сайт LEGO и оцените размещаемый там пользовательский контент. 
Один из популярных способов продвинуть продукт или услугу именно таким путем — хэштег-челлендж. Алгоритм достаточно простой: бренд генерирует креативную идею для ролика и запускает «волну» среди потребителей. Хороший пример — челлендж от «Сбербанка».
Аккаунт компании «Сбербанк» в TikTok был создан в марте прошлого года, и его задачей было наращивание активной аудитории, возрастом от 14 до 25 лет. Конечная цель — увеличить процент открытия молодежных карт и операций в онлайн-банкинге. 
Для участия в челленджах было привлечено 20 блоггеров [для работы с молодежными картами] и 8 блогеров [по программе «Переведи на Сбер»]. Это принесло 3,5 и 1,9 миллионов просмотров соответственно.

Платная реклама в TikTok


На площадке есть рекламные инструменты, и кроме органической оптимизации видео, можно также настроить таргетированную рекламу. Для этого здесь есть специальный кабинет. Однако, чтобы начать им пользоваться, нужно стать партнером TikTok — подписать агентский договор. Только после этого появится возможность работать с рекламодателями.
Те, кто уже работал в рекламном кабинете Facebook, быстро освоятся в TikTok, ведь тот похож на упрощенную версию первого. Пусть вас не смущает странная локализация на русском: «Беседа» и «Нагрузка» — это всего-навсего старые добрые «Конверсии» и «Трафик». 
Чем может быть полезен агентский кабинет TikTok:
  • работа с рекламодателями и просмотр их общей статистики;
  • создание рекламных кампаний (на уровне рекламодателя);
  • распределение рекламного бюджета;
  • назначение ролей (для просмотра, редактирования).
Всего в TikTok доступны три цели для рекламодателя: 
  1. Трафик
  2. Конверсии
  3. Установка приложений

Создание рекламных объявлений в TikTok


Процесс настройки объявлений в TikTok предельно прост и, как уже говорилось выше, во многом схож с работой Ads Manager на Facebook. Поделимся несколькими лайфхаками о том, как получать лучший результат при настройке объявлений:
  • Будьте креативны! 
  • Осваивайте нативный формат и вертикальную видеосъемку.
  • Подсматривайте и анализируйте, что больше нравится вашей ЦА.
  • Не забывайте об авторских правах! Не ставьте на фон видео музыку известных исполнителей — ваш ролик не пройдет премодерацию.
  • Заменить музыку в уже размещенном видео можно, зайдя в подраздел Library в настройках Smart Video Soundtrack. Одно из преимуществ TikTok — это большая библиотека лицензионного аудиоконтента!
  • Рассчитывайте суточный бюджет для своих объявлений с умом: посмотрите сколько стоит конверсия и выделите на рекламу бюджет, который соответствует вашим ожиданиям по количеству конверсий.
  • Внимательно указывайте теги и категорию своих товаров.
  • Поиграйтесь с настройкой «Automated Creative Optimization» — так TikTok начнет сам комбинировать ваши ролики в поисках лучших сочетаний.
  • Не стоит чересчур сужать свою аудиторию — потеряете в оптимизации.
  • Тестируйте разные варианты с делением по возрасту, интересам и т.д.
  • Если не указывать язык в соответствующей графе, вашу рекламу увидит большее количество пользователей, например, англоязычных.
В целом, интерфейс TikTok интуитивно понятен, со множеством популярных и полезных функций. Его юзабилити реализован очень качественно. Среди прочего здесь можно найти:
  • Библиотеку с менеджером событий, где можно быстро и удобно настроить свои ивенты, приложения и Пиксель.
  • Креативный центр с хорошим выбором настроек и шаблонов для редактирования.
  • Аудитории, в т. ч. на основе взаимодействий с рекламой, сайтом, приложениями. Здесь же можно настроить Look-alike.
  • Отчетность, в которой можно создавать и выгружать детализированные отчеты.
Технические требования к размещаемым видео следующие:
  • Предельный размер файла для iOS — 250 Мб, Android — 75 Мб
  • Кодек — H.264
  • Соотношение сторон — 9:16
  • Размер — 1080х1920 пикселей
  • Форматы — mov, mp4

Полезен ли TikTok для бизнеса?


Гайдов и советов по инструментам, настройкам, креативу в TikTok — море. Уже существуют целые сайты, посвященные инструкциям и лайфхакам для русскоязычных пользователей. Что лишь доказывает популярность сервиса, которая растет в разы быстрее, чем даже у Facebook и Instagram.
У TikTok есть все необходимые перспективы для роли полноценного канала продвижения в сети и повышения продаж. Особенно как платформы для креативной, неагрессивной рекламы, создатели которой не боятся искать новые пути взаимодействия с аудиторией.

https://bit.ly/3eo2KRY

четверг, 9 июля 2020 г.

How to write a user story


Writing user stories takes a bit of practice when you are new to agile. That’s why we have developed this simple guide and handy graphic to get you started! They are covered in the popular Agile Project Management course.
If you think this guide will give others a good start to writing user stories, feel free to link to it from your blog or share it with your networks.


What is a user story in agile?

A user story is a simple description of a requirement and is a popular agile method to capture user requirements. It serves as a guide for the team about a user requirement. User stories are one of the many agile technique or methods which you will learn on the Agile Project Management courses.
User stories provide context and clarity of expectations, without focusing on technical details. Defining technical details too early can discourage alternative design options and changes. Being purposely vague, user stories provide room for creativity and interpretation.
A user story speaks from the end user perspective and follows this format:
As a ….. I want to ….. so that …..
User stories encourage team conversation which may uncover hidden assumptions and requirements. They are to be kept brief and should always meet the allocated acceptance criteria or definition of “Done”.

Who can write a user story?

Users are the ideal people to write user stories. If you’re using Scrum, it’s the Product Owner’s job to keep the Product Backlog full of user stories. The highest priority stories are pulled from the backlog to work on during a Scrum sprint.

How to write a user story

The key to writing an effective user story is to determine the who, what and why. Ensure that your user stories follow the I.N.V.E.S.T. standard – independent, negotiable, valuable estimable, small and testable.

1. Define your end user

The first thing to do when writing your story is to define your end user. Who is the person that will be using your product? A helpful way to visualise your user is to make them a persona profile. Give the person a name and find them a photo. Add their relevant attributes, attitudes and behaviours. Finally, give them a goal. The following example is a user definition for a smart baby monitor.
Example:
As a [parent]

2. Specify what your end user wants

For this part you’ll need to think about the solution your product is offering. What does your end user want from your product? Refer to the “goal” section of your persona profile, then add a brief description of this to your story. The following example shows what the end user wants from using a smart baby monitor.
Example:
As a [parent], I want to [check up on my sleeping baby without going into their room]

3. Describe the benefit of your product

Imagine that you are the end user speaking to the product developer. Tell the developer the benefit you will gain from using this product. The following example shows how the end user will benefit from using a smart baby monitor.
Example:
As a [parent], I want to [check up on my sleeping baby without going into their room], so I can [ensure their safety without disturbing them].

4. Add acceptance criteria

In agile, teams are required to deliver products that are potentially shippable. Acceptance criteria is the clearest and quickest way to determine whether a user story is done or not-done.
Each user story should have at least one acceptance criteria but try not to list too many. You can use S.M.A.R.T objectives to ensure your criteria are measurable. Always remember to write from your end user’s perspective and not confuse acceptance criteria with a to-do list.
Example:
As a [parent], I want to [check up on my sleeping baby without going into their room], so I can [ensure their safety without disturbing them].
- Night camera installed on baby’s cot monitor
- Baby temperature and breathing monitor function
- Data sent to parent’s smartphone
- Parent alert sent to smartphone if problem occurs

Start building your backlog

Once you have written your user story, you can add it to the backlog. Once you have a bunch of user stories, you can work on prioritizing and estimating the effort.
Embracing change is all part of the agile ethos, so product requirements may change during a sprint and you can refine your user stories as you progress. If you find that your user story is becoming complicated or undoable, you can break it into smaller user stories. That way, the stories are less likely to be left not-done at the end of a sprint.

The DSDM principles: A visual guide


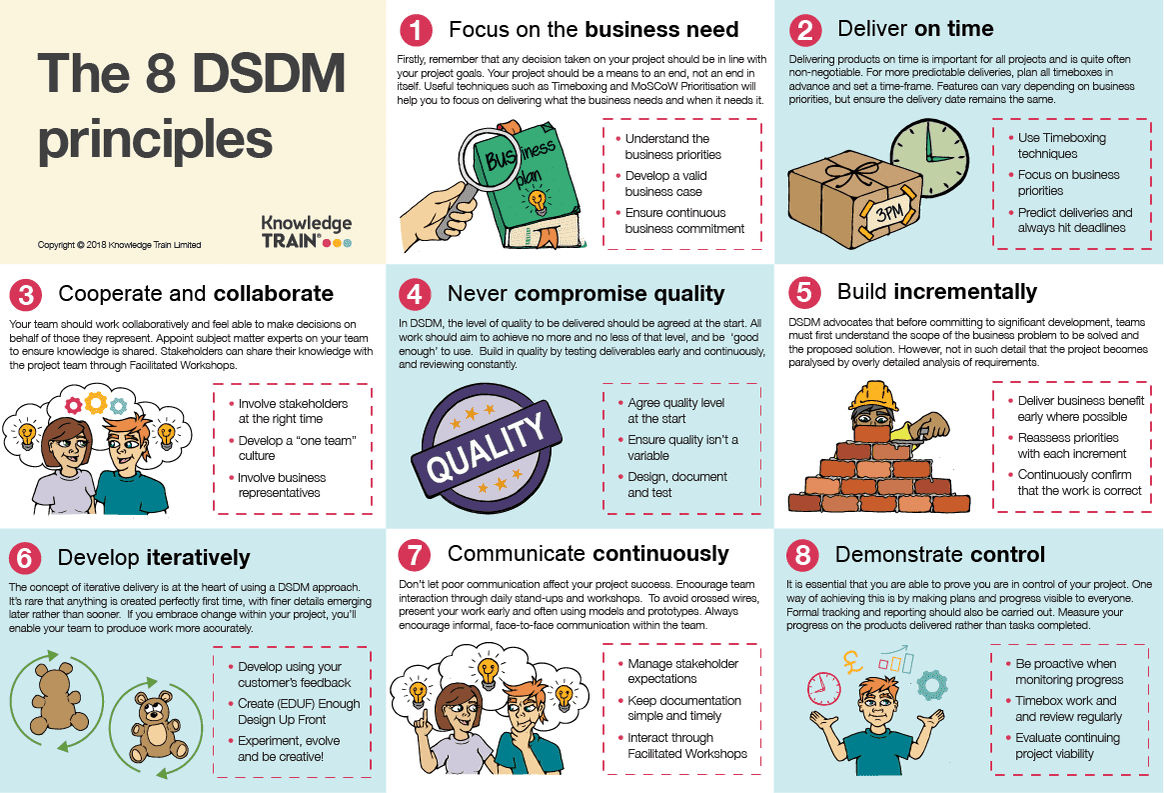
Learn the 8 DSDM principles and ensure they stick in your mind with this handy graphic and article. Ideal if you are working on DSDM projects at the moment or taking an AgilePM course.

Principles are the building blocks

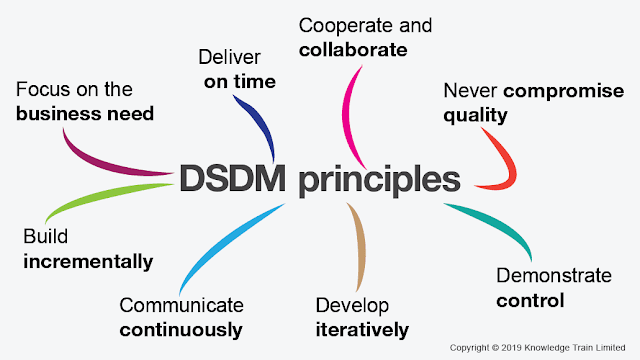
DSDM has eight principles underpinning the framework. Each principle must be adhered to by the project team, as ignoring any of the principles can increase the chance of project failure.
The graphic below was created to help you learn about DSDM. If you like it, please show your appreciation by linking back to this page.
Now, let’s find out more about the DSDM principles and how teams can ensure they stick to them.
 

1. Focus on the business need

DSDM has a strong business-driven approach. A business case must be established for the project and the team must understand project priorities. Every decision the team make during the project should help achieve the project goal and the team must ensure the project is delivered on time.

MoSCoW prioritisation

To adhere to this principle, DSDM teams have several tools at their disposal. For example, the MoSCoW technique helps the team prioritise which of the business requirements Must be, Should be, Could be or Won't be delivered. Timeboxing helps to separate work into manageable chunks of time, with each chunk having its own deliverables and deadline.
The Foundation phase in DSDM also helps the team build focus. During this phase, team roles are established. The team then form the overall strategy, decide how risk/quality will be assessed, how technology will be used and how the project will be managed.

2. Deliver on time

DSDM places a strong emphasis on prompt delivery, proposing that even projects without any need for a fixed deadline still benefit from one. This is because having deadlines is the best way to control changing requirements. To stick to this principle, DSDM teams should focus on priorities, hit deadlines and manage their time by using the MoSCoW and timeboxing techniques.

3. Collaborate

Team spirit and collaboration is highly important for DSDM teams. This is based on a rejection of having multiple departments that rarely interact. Teams should instead work as one unit and collaborate to encourage understanding, higher performance and shared ownership.

Business and technical staff work together

DSDM teams fulfil this principle by having business and technical staff together in the team, instead of separately. The team involve stakeholders throughout the project and ensure each team member feels empowered to make decisions. The team use ‘workshops’ to meet stakeholders and involve them in the project.

Ensuring collaboration

The visionary, ambassador and business advisor roles also ensure collaboration. The visionary conveys the sponsor’s needs to the team and ensures the business case objectives are achieved. Ambassadors communicate user’s needs to the development team, whilst business advisors assist with areas such as law or marketing. On a non-agile project, these roles would be performed outside of the project or would not exist at all.

4. Never compromise quality

Quality is always fixed on DSDM projects and must be decided at the start. The final product shouldn’t be any more or any less than the quality decided upon.

Continuous testing

To adhere to this principle, DSDM teams must ensure quality doesn’t become a variable by testing continuously and reviewing constantly. This testing and reviewing occurs during the ‘exploration’ and ‘engineering’ iterative development phases. Testing should happen early in the project. Again, MoSCoW and timeboxing can be used to ensure testing is appropriate and organized.

5. Build incrementally from firm foundations

DSDM differs from other agile methods as it requires the foundations of the project to be agreed early. The foundations don’t need to be in too much detail – just agree on what the problem is and how to solve it. Once foundations are established, the solution must be delivered incrementally.

Just enough design up front

To adhere to this principle, DSDM teams must ensure they perform analysis and ‘enough design up front’ (EDUF) at the start of the project. During each increment, the team must re-assess priorities and project viability, ensuring they have taken stakeholder feedback into consideration. Both the feasibility and foundation phases allow for establishing a foundation; the exploration and engineering phases allow for incremental delivery.

6. Develop iteratively

DSDM proposes that nothing is created perfectly first time and projects operate in a constantly changing world. Incremental delivery allows for such change to be embraced and leads to higher stakeholder satisfaction. Each iteration is combined with testing, demonstrations and feedback. This ensures that each iteration improves upon the last and leads to a decent final product.

Feedback loop

DSDM teams can adhere to this principle by building feedback into each iteration. They must also be in the mindset that details should emerge later, not sooner, and they must embrace change. During each iteration, they should encourage creativity and experimentation, which will lead to learning and improvement. Constant review and feedback allow for change and progress to occur.

7. Communicate continuously and clearly

Bad communication often leads to project failure and traditional non-agile approaches fail to address this. DSDM aims to improve communication by using frequent face-to-face meetings, visual communication (modelling), advance releases of prototypes and workshop sessions.

Daily stand-ups

DSDM teams can fulfil this principle with several methods. One way is to encourage team interaction through daily stand-up meetings. These informal meetings allow the team to meet and discuss issues or ideas together. Facilitated workshops are also an effective way for stakeholders to improve their understanding and discuss requirements.
DSDM teams commonly use modelling and prototyping to further improve communication. These practical methods help replace the need for heavy, useless documentation.

Modelling

Modelling is a visual form of communication utilizing diagrams. This allows for complex systems, designs and products to be better understood.

Prototyping

Prototyping means creating prototypes of the product early in development, to allow stakeholders to ‘test-drive’ early versions of the solution.

8. Demonstrate control

It is vital to keep control of the project. DSDM proposes that it is only possible to do this by using a plan aligned to the project aims, with both being accessible to the entire team.

Ensure progress is visible

DSDM teams, especially the project manager and team leader, can fulfil this principle by ensuring plans and progress are visible to everyone. Managing must be proactive with an emphasis on reporting and tracking.

Measure progress by delivery

Also, progress must be measured by looking at what has been delivered, rather than activities completed. Timeboxing helps to control who is doing what and when. DSDM can also be combined with methods such as Kanban, which help teams to visualize project progress and see who is doing what, when and how long it will take them.

Summary

As you might have noticed, the eight DSDM principles embody the principles of the agile manifesto. The focus on iterative delivery, effective communication, collaboration and continuous delivery all align with the agile philosophy. DSDM also has some of its own characteristics – it’s process model and specific team roles - for instance. Yet, many of the other tools and techniques recommended by DSDM - modelling, prototyping and workshops, timeboxing, MoSCoW - are used by other agile methods.

DSDM® is a Registered Trade Mark of Agile Business Consortium Limited.

среда, 8 июля 2020 г.

Технология Assessment Center: шесть отличий от подделки


Ирина Грабская
Как-то в детстве на пляже я услышала забавный диалог. Цыганка зычно рекламировала изделия из эпоксидной смолы: «Янтарь! Янтарь!». Когда кто-то из отдыхающих заметил: «Это же не настоящий янтарь!», цыганка быстро нашлась: «Ну, не янтарь, так из-под янтарь».
В нашей семье, сталкиваясь с какой-то подделкой, еще долго вспоминали ее слова. Именно эта цыганка вспомнилась мне, когда редакция предложила написать о профессиональных стандартах при проведении Центров оценки. Уж очень часто на украинском рынке присутствует что-то «из-под ассессмент», которое серьезно компрометирует очень полезный инструмент.

В статье мы не обсуждаем цели и границы применимости метода, а сосредоточимся на стандартах технологии, понимание  которых поможет отличить профессиональное проведение Центра оценки и развития от фальсификаций.
Подделку можно распознать уже на первой встрече с провайдером услуги, задав ему несколько
вопросов и ознакомившись с инструментами, а также примером программы и т.н. слепого отчета
(отчет без имени участника и названия компании).
Приведем эти вопросы.

1. По каким критериям Вы будете оценивать участников?

Метод создан в концепции подхода по компетенциям и в ходе Центра оценки и развития могут оцениваться только компетенции. Если в компании разработана модель компетенций, то оценка проводится в соответствии с профилем компетенций данной должности. Если профиля нет или он требует пересмотра, то его необходимо разработать. При разработке профиля не достаточно просто использовать стандартные определения из библиотеки компетенций, важно проделать специальную работу по выделению ключевых факторов успеха именно в данной должности в конкретной компании.
В разработанном профиле каждая компетенция описывается через определение, а также 5–8 поведенческих индикаторов. Поведенческие индикаторы – это конкретные действия, поэтому они формулируются в глагольной форме. Например, для компетенции «принятие решений» одним из индикаторов будет «рассматривает альтернативы».  Только при таком описании легко наблюдать и оценивать конкретные действия участника.

Типичная подделка – «портрет». Часто у оценщиков нет перечня поведенческих индикаторов или их перечень является неполным: например, в компетенции «ориентация на результат» все индикаторы связаны с активностью и отсутствуют индикаторы, связанные с постановкой целей, использованием ресурсов.
Часто профиль компетенций используется формально, но критерии оценки подменяются субъективными впечатлениями. Отчет выглядит как своеобразный «психологический портрет», со словами (цитирую!) «он бессознательно стремится», «эгоцентризм», «заложенные в нем»  и т.п. В таких цветистых «портретах» явно проступают краски фантазий и эмоционального отношения «оценщиков-импрессионистов» к участнику.

2. Какие инструменты Вы планируете использовать?

В Центре оценки и развития применяется несколько инструментов: бизнес-кейсы, интервью по компетенциям, тесты и личностные опросники.
Бизнес-кейсы – необходимые инструменты Центра оценки и развития. Без них очень трудно оценить важные для бизнеса компетенции. Бизнес-кейс моделирует деятельность некоей условной компании. Его уровень сложности соответствует реальным проблемам, которые решаются на определенном уровне менеджмента. «Папка документов», которую получает участник, включает разноплановые материалы: финансовую документацию, отчеты, электронную переписку и т.п. На основании их анализа сотрудник анализирует проблемы, принимает решения, определяет возможности для изменений. В структуре кейса заложена возможность проявить определенные компетенции. Хороший кейс похож на детектив: в нем есть внутренняя драма, конфликты интересов, возможность нескольких разноплановых решений.

Типичный подлог – «тренинговый квест» – использование в Центре оценки и развития тренингового упражнения. Любимое упражнения непрофессионалов – «Кораблекрушение». Что можно оценить в этом упражнении? Вероятно, коммуникативную активность, экспрессивность, частично – влияние. А какие далеко идущие выводы делают «оценщики» из этого упражнения! В результате такого кораблекрушения» за бортом оказываются, например, вдумчивые интроверты, которых не вдохновила игра. Ведь, как правило, «оценщики» не сообщают участникам такой игры, для чего используется упражнение, что на самом деле они измеряют. Может быть, потому что сами не всегда об этом догадываются?

Тренинговые упражнения не подходят для Центра оценки и развития по нескольким причинам:

•    они созданы с целью обучения конкретным навыкам, а не с целью проявления компетенций;
•    в них мало простора для проявления компетенций;
•    тренинговые упражнения предполагают ограниченное  количество решений, в них часто заложено одно правильное решение;
•    мотивация участников тренинга отличается от мотивации участников Центра оценки.

3. Как построена программа Центра оценки?

Для того чтобы оценить компетенцию на определенном уровне, ее необходимо наблюдать многократно, в разных контекстах. Поэтому инструментов должно быть несколько. Например, в бизнес-кейсах перед менеджером высшего звена могут стоять следующие задания: разработать стратегию компании, решить определенные проблемы, спланировать рабочую неделю, провести встречу с подчиненным, руководителем или клиентом. Чтобы человек смог проявиться, контексты упражнений также должны быть разноплановыми: интервью, групповая дискуссия, письменное упражнение, презентация, ролевая игра, в которой партнерами по игре являются специально подготовленные профессионалы.

Принцип построения программы – одна компетенция должна оцениваться, как минимум, в двух разных заданиях. В одном задании оценивается порядка четырех компетенций. Таким образом, в течение дня при напряженной программе реально оценить не более восьми компетенций.

Типичная подделка – «рулетка»: программы нет, все компетенции наблюдаются во всех упражнениях по принципу «а вдруг проявится?». В упражнениях не заложена возможность обнаружить каждую из компетенций. На основании одной фразы участника делаются далеко идущие выводы сразу о нескольких компетенциях, и наоборот, какие-то признаки наличия компетенции упускаются. Это приведет к большому количеству низких оценок и комментариям: «участник не умеет», «он не делает». Такой подход проявится также в «плоских профилях», когда человек получает одинаковые оценки по разным компетенциям. Причина в т.н. эффекте ореола, когда оценки базируются не на конкретных поведенческих проявлениях компетенции, а на общем впечатлении. Жаль только, что ошибки становятся очевидными для многих, когда оценка уже проведена. А ведь анализ инструментов и программы может предотвратить подобные проблемы.

4. Как будет осуществляться коммуникация участникам?

Профессиональный подход состоит в том, что участников заранее и полно информируют об оценивании. Если оценивание осуществляется внешним провайдером, то на старте проекта обсуждается коммуникация со стороны компании и со стороны провайдера. Организация должна обязательно проинформировать участников о целях и последствиях оценивания. Провайдер сообщает также о том, какие компетенции будут оцениваться и какими инструментами.

Типичный подлог «Мистерия». Если не выстроена коммуникация, участники приходят с неверным представлением о целях, недоверием в отношении метода. Для них оценка покрыта тайной и вызывает опасения. Не понимая, какое поведение сочтут эффективным, участники то отмалчиваются, то, наоборот, говорят общими фразами, проявляют бессодержательную активность и т.п.

Иногда оценщики сознательно скрывают информацию, например, об оцениваемых компетенциях.
Они опасаются, что, зная критерии оценки, участники получат подсказки. Это ложное опасение и верный признак того, что оценщики не ориентированы на оценку действий, они боятся обмануться «рассказом о компетенциях». Если  эксперт оценки в интервью по компетенциям спрашивает участника о конкретных ситуациях и его действиях, а не довольствуется общими подходами по принципу «я обычно», то получает достаточно материала для точной оценки компетенций.

5. Как будут представлены результаты? Какие рекомендации получат участники?
 
По результатам Центра оценки и развития участники получают отчет.  Заранее оговаривается, кто, помимо участника, является владельцем конфиденциальной информации отчета (например, руководитель и HR).
В отчете содержатся оценки по компетенциям, описание каждой компетенции (сильные стороны и зоны развития), а также рекомендации по развитию. Если проводился Центр оценки (а не Центр развития), рекомендации могут не предоставляться.
Советы формулируются в форме конкретных действий, например: «Отмечайте не только ошибки,
сделанные подчиненными, но указывайте, какого именно поведения вы ожидаете от них в будущем».

Типичный подлог «Проповедь», когда рекомендации формулируются в терминах «будьте более внимательным», «развивайте концептуальное мышление». Без указания конкретных действий они становятся бесполезными для развития.

6. Сколько и какие эксперты оценки вовлечены в проект? 

Оценивание компетенций требует высокого уровня квалификации, поэтому эксперты оценки должны быть специально обучены.
При внутренней оценке важно, чтобы оценщиками не были специалисты, которые по уровню менеджмента ниже, чем оцениваемые. Даже при их высокой квалификации доверие к процедуре и результатам не будет высоким.
Для обеспечения объективности одного участника должны наблюдать два–три эксперта оценки.
Поэтому программа строится таким образом, чтобы в различных упражнениях принимали участие разные эксперты оценки. Встреча экспертов для обсуждения оценок должна быть обязательно предусмотрена в расписании Центра оценки и развития.

Типичный подлог: «Мистификация». Эксперты оценки не обучены и не сертифицированы, апеллируют к опыту, интуиции, иногда – к психологическому образованию. Все это еще не является гарантией их высокого уровня как специалистов.
Каковы же признаки профессионального проведения Центра оценки и развития?
1. Оценка проводится на основании профиля компетенций, который соответствует ключевым факторам успеха в данной должности.
2. Компетенции полно определены через поведенческие индикаторы, поведенческие индикаторы сформулированы в глагольной форме.
3. Эксперты оценки оснащены программой, оценочными формами.
4. Используются разные типы инструментов: бизнес-кейсы, интервью по компетенциям, тесты и личностные опросники.
5. Тесты и опросники прошли специальную проверку. Проверка осуществлялась на выборке, соответствующей участникам оценивания, есть статистические нормы и математическое подтверждение валидности и надежности тестов.
6. Бизнес-кейс моделирует бизнес-ситуацию, в нем нет однозначных решений.
7. Кейс  дает возможность проявить несколько компетенций, причем на разном уровне (а не по принципу делает/не делает).
8. Оценивается поведение, а не общее впечатление.
9. Принцип построения программы и оценивания:
a. одна компетенция оценивается, как минимум, в двух разных заданиях;
b. одно проявление – оценка по одной компетенций;
c. одного участника оценивают разные эксперты.
Итоговая оценка – результат обсуждения.
10. Центр оценки и развития – самодостаточный инструмент, это не тренинг. Участники четко информируются о целях и последствиях оценки, критериях оценивания и особенностях метода.
11. По итогам Центра оценки и развития участники получают полный отчет и обратную связь.
12. Эксперты оценки прошли обучение и сертификацию.

Центр оценки и развития: взвесим риски непрофессионализма

1. Первый и очевидный риск для компании – неверное определение потенциала кандидатов и ошибочные кадровые решения.
2. Даже если оценка не влияет на кадровые решения непосредственно, а результаты используются исключительно в целях развития, необходимо учитывать риски для участников – бесполезные рекомендации, а часто и психологические травмы.
3. Центр оценки – это всегда важное для участников событие. Как показывает практика, недооценка настолько демотивирует, что после нее сотрудники часто задумываются о том, чтобы покинуть компанию.
4. Однако и высокие оценки талантов при отсутствии возможностей для развития и роста снижают лояльность.
5. Результаты Центра оценки – это еще и некоторый месседж. Например, если в пул талантов попали не самые потенциальные сотрудники, у персонала формируется искаженное представление о том, что ценится в компании.
6. И последний риск – авторитет HR-а или консультанта, когда позднее результаты показывают низкую прогностическую валидность, т.е. попросту не проходят проверки временем.
Хотите ли вы этим рисковать?

"Эффект Пигмалиона" - ожидания сбываются


Эффект Пигмалиона – это явление, которое состоит в том, что человек, убежденный в верности той или иной информации, непроизвольно ведет себя таким образом, что данная информация получает подтверждение.

История вопроса

Мифологический царь Кипра и, по совместительству, греческий скульптор Пигмалион, по легенде, создал статую девушки удивительной красоты. И чем дольше любовался он делом свих рук, тем больше находил в нем замечательных достоинств. Вскоре Пигмалиону стало казаться, что ни одна из земных женщин не способна сравниться со статуей, которую он изваял.  Назвав свое творение Галатеей, Пигмалион проводил дни и ночи напролет, восхищаясь красавицей из слоновой кости, любуясь ее нагими прелестями, одаривая ее щедрыми дарами, шепча нежные слова любви…
В день праздника влюбленный скульптор обратился к Афродите со страстной мольбой оживить его любимую, и богиня любви откликнулась на его просьбу. Не помня себя от счастья, помчался Пигмалион в свою мастерскую, где ждала его прекраснейшая из женщин. Живая, теплая и любящая – Галатея оказалась именно такой, какой и хотел видеть ее тот, кто ее придумал. Пигмалион получил то, что хотел, — его вера и страстное желание помогли мечте воплотиться в реальность. Подобный психологический феномен оправдывающихся ожиданий и лежит в основе эффекта Пигмалиона.
Эффект Пигмалиона (или эффект Розенталя) — это психологический феномен, который заключается в том, что ожидания человеком реализации пророчества во многом определяют характер его действий и интерпретацию реакций окружающих, что и провоцирует самоосуществление пророчества.

Или, проще говоря, когда мы твердо убеждены, в достоверности какой-либо информации, мы зачастую действуем таким образом, что эта самая информация получает реальное подтверждение. Убедительным доказательством этому служит знаменитый эксперимент, проведенный в 1968 году американскими психологами Робертом Розенталем и Ленорой Якобсон.

Дети Розенталя

Исследователи Розенталь и Якобсон в самом начале учебного года явились в одну из школ Сан-Франциско для того чтобы определить уровень интеллекта учащихся. В результате, в каждом из классов ими было отобрано по несколько учеников, которые, по мнению психологов, были наделены выдающимися умственными способностями. «Если даже пока эти дети никак не заявили о себе, — в ближайшее время их интеллектуальный потенциал непременно раскроется! Ждите!» — заверили порядком удивленных учителей Якобсон и Розенталь. У педагогов был повод для удивления, — дело в том, что учащиеся, которых исследователи прочили в интеллектуальные светила, пока никак не демонстрировали особой склонности к умственной деятельности. Ну, то есть в числе отстающих они не значились, но и «звезд с неба» тоже не хватали. «Что ж, исследователям, наверное, виднее» — рассудили учителя и стали ждать от перспективных учеников обещанных результатов.
Между тем, учащихся с якобы высоким уровнем IQ психологи выбрали абсолютно случайно, «от фонаря»! Самое интересное, что когда в конце учебного года Розенталь и Якобсон снова пожаловали в уже знакомую школу с целью измерить коэффициент интеллекта учеников, они обнаружили, что те самые дети, которые были объявлены ими особо способными, и впрямь показали высокий уровень IQ!
То есть, эксперимент вполне убедительно доказал: мы получаем то, во что верим. Так, школьные учителя, уверовавшие в высокий интеллектуальный потенциал отдельных учеников, вольно или невольно передали свои ожидания этим ученикам, а те, в свою очередь, оправдали надежды поверивших в них учителей и достигли значительных результатов. Одним словом, что хочешь – то и получишь.
Особенно это касается детей из неблагополучных семей, от которых зачастую никто и ничего хорошего не ждет. Не удивительно, что худшие ожидания окружающих в подобных случаях оправдываются. И напротив, нередко, стоит иногда авансом похвалить такого ребенка, поверить в него, как, окрыленный этой верой, он «расправляет плечи» и преображается буквально на глазах.
Впрочем, речь идет, конечно, не только о детях. Руководители, связывающие свои позитивные ожидания с определенными сотрудниками, оптимистично настроенный врач, уверенный в том, что его пациент благополучно излечится от болезни, – тоже так или иначе, создают особый микроклимат, в котором самооценка и вера в себя у подчиненного или пациента растет, а его успехи – множатся.

А в 1988 году Дж. Стерлинг Ливингстон опубликовал в Harvard Business Review статью «Эффект Пигмалиона» в сфере управления». Ее до сих пор включают в курс менеджмента в некоторых бизнес-школах.
Речь вот о чем. Ожидания руководителя от подчиненных (эффект Пигмалиона) и их ожидания от самих себя (эффект Галатеи) – ключевые факторы, влияющие на их результативность, способные буквально вдохнуть в сотрудников жизнь. Эффект воздействия ожиданий на результат известны и врачам, и педагогам, и многим другим профессионалам, чья работа связана с людьми. А менеджерами он, как ни странно, часто недооценивается или вовсе выпускается из виду.
Силу ожиданий сложно переоценить. Причем использование этого инструмента не требует финансовых затрат (хотя менеджеру и придется тратить некое количество своего внимания, умственной и эмоциональной энергии). Эффекты Пигмалиона и Галатеи – это фундаментальные принципы, которые вы можете применить на рабочем месте при построении ожиданий результативности и потенциального её улучшения.
В общих чертах, эффект Пигмалиона можно описать таким образом:
  • Каждый руководитель имеет определённые ожидания от людей, которые ему подчиняются
  • Руководители передают эти ожидания, сознательно или несознательно (даже отказ от общения с подчиненным – это передача ожидания)
  • Люди принимают, сознательно или несознательно, считывают эти ожидания
  • Люди действуют в соответствии с ожиданиями, которые они получили от руководителя
Эффект Пигмалиона позволяет сотрудникам превосходить себя в ответ на посыл менеджера о том, что они могут преуспеть и что от них ожидают успеха. Посыл может принимать самые разные формы: «Я уверен, что мы успеем это сделать даже раньше намеченного срока», «Я верю, что ты это сделаешь в самом лучшем виде» (только не надо путать это с манипуляцией). На первый взгляд банальные фразы, но в реалиях имеют магическое действие, особенно если сопровождаются правильными и искренними невербальными посылами (позой, голосом, жестами и т.д.).
Эффект Пигмалиона также может понизить результативность работы сотрудников, когда «тонкое» сообщение от менеджера говорит им, что от них не ждут великих свершений и вообще в них не верят. Например, одного из подчиненных руководитель хвалит за результаты работы реже, чем других, при их приблизительно равной результативности. Или если шеф реже разговаривает с конкретным сотрудником, чем с остальными. К слову, руководитель может дистанцироваться от подчиненного как раз ради объективности, полагая, что действует во благо: «Хвалить не за что, ругать не хочется, лучше промолчать». Но подчиненный такой сигнал считывает правильно.
«Кроме вещей, которым может научиться любой (манера одеваться, правильная речь и тому подобное), разница между леди и цветочницей – не в том, как они ведут себя, а в том, как с ними обращаются. Для профессора Хиггинса я всегда буду цветочницей, потому что он обращается со мной как с цветочницей… Но я знаю, что с вами я могу быть леди, потому что вы обращаетесь и всегда будете обращаться со мной как с леди», — говорит Шоу устами своей героини Элизы.
«Если руководитель недостаточно умел или мудр, он оставляет шрамы на карьерах молодых людей, глубоко задевает их самооценку и искажает их восприятие себя как личностей. Но если он искусен и ожидает многого от своих подчинённых, то их самооценка будет расти, способности – развиваться, а результативность будет находиться на высоком уровне. Чаще, чем он может себе представить, менеджер – это Пигмалион», — отвечает ему Ливингстон.
Поэтому задача хорошего менеджера – помочь подчиненным поверить в себя (породить эффект Галатеи), сделать так, чтобы вера в себя появилась из-за веры другого в меня. Вы могли слышать термин «самоисполняющееся пророчество». По большому счету, оно и лежит в основе описываемых эффектов: мнение индивида о своих способностях и ожидания от своей результативности сильно влияют на реальную производительность…
Конечно, эта концепция не так проста и однозначна. Многие другие факторы также влияют на уровень результативности сотрудников: корпоративная культура компании, жизненный опыт работников, их образование, поддержка семьи, и взаимоотношения с коллегами. Однако позитивное руководство – один из ключевых факторов, который позволяет удержать хороших работников в компании.
Итак, как же стать Пигмалионом от бизнеса?
Вот несколько способов, с помощью которых вы можете вселить в ваших сотрудников мощные, положительные ожидания от себя:
  • Создайте возможности для сотрудника приобрести опыт. Ставьте ему задачи постепенно растущей сложности. Убедитесь, что он справился с заданиями на каждом уровне, прежде чем двигаться дальше
  • Позвольте сотруднику участвовать в потенциально успешных проектах, которые будут привносить долгосрочные улучшения в его работу и работу команды
  • Определяйте вместе с сотрудником зону его ближайшего профессионального развития, предоставьте возможности, которые бы позволили работнику приобрести желаемые им знания
  • Назначьте успешного, опытного старшего сотрудника на роль наставника для новичка
  • Поддерживайте частую (тут тоже нужна мера) позитивную вербальную коммуникацию с сотрудником; дайте ему понять, что ваша компания верит в его способность выполнить работу. Постарайтесь сделать обратную связь положительной, и, если возможно, развивающей. Покажите вашу веру в успех и дальнейшее развитие сотрудника.


2020 External Vulnerability and Resilience rankings for 63 countries: COVID-19 Crisis Update

Amid the 2020 global pandemic, Georgia, Turkey and Argentina are the “risky-3” in Scope’s biennial update of its external vulnerability and resilience framework, whereas Taiwan, China and Switzerland are the 2020 “sturdy-3” of the most well positioned economies against external shocks from a sample of 63 economies.

Fraught global trading and “risk-off” market conditions exacerbated by the coronavirus outbreak and oil price declines of 2020 expose vulnerabilities that many economies face due to balance of payment pressures. This year, Lebanon defaulted on a USD 1.2bn Eurobond, Argentina and Ecuador’s debts re-entered selective default, and Zambia is on the brink. There are concerns about a wider emerging market crisis. Meanwhile, with Brent prices at below USD 30 a barrel, this level is significantly under prices all oil exporters require for balanced budgets. With severe stressing factors in play, external vulnerabilities are key to monitor in assessing countries’ debt repayment capacities.
In this report, Scope provides an update of its external vulnerability and resilience two- axis coordinate grid, introduced in 2018, which assesses countries on a) vulnerabilities to balance of payment crisis and b) degrees of resilience in the advent of such crises.

Figure 1: Top 5 weakest and strongest countries, external risk framework

Top 5 strongest


Top 5 weakest


1Of 63 countries. Full scores and rankings for 63 countries in Annex I. 2Change in axis rank since 2018 update.

Scope’s 2020 external vulnerability and resilience rankings indicate a fresh “risky-3” of Georgia (rated BB/Negative), Turkey (BB-/Negative) and Argentina (unrated) – three economies that not only have vulnerability to the onset of balance of payment issues but also show significant weakness in abilities to withstand crises. Argentina slides into this year’s risky-3, edging out Ukraine, which was in the original 2018 risky-3 roster. Ukraine, Colombia, Indonesia, Egypt and Pakistan (all unrated) are highly at-risk economies just outside the riskiest 3. In addition, Scope observes a 2020 “sturdy-3” of Taiwan (unrated), China (A+/Negative), and Switzerland (AAA/Stable) – economies that are the most robust to external shocks. Taiwan replaces Japan (A+/Stable) in this year’s sturdy-3.

Scores for major Western economies vary: the United States (AA/Stable) receives strong marks on external resilience, supported by dollar primacy (4th most resilient of 63), and Italy (BBB+/Stable) and Germany (AAA/Stable) continue to display external sector strengths – supported by current account surpluses. France (AA/Stable) has average scores but Spain (A-/Stable) continues to score weakly on both framework axes. The UK (AA/Negative) displays deficits especially on external vulnerabilities.

Inside the EU, Scope finds that Cyprus (BBB-/Stable), Croatia (BBB-/Stable) and Romania (BBB-/Negative) are the three EU member states facing the greatest external sector risks. On the other end, Malta (A+/Stable), Luxembourg (AAA/Stable) and Denmark (AAA/Stable) are the EU sturdy-3.

Scope’s external vulnerability and resilience framework


Scope’s sovereign credit rating assessments are based on five analytical pillars, of which “external economic risk” represents one of these five dimensions, with a 15% weight in the overall sovereign rating review process. However, the significance of external sector risks may be disproportionately important in 2020 as global trade flows weaken to multi- decadal lows and capital outflows escalate amid a global sudden stop due to the Covid- 19 crisis. Emerging economies exchange rates have been hit hard, making their foreign- currency-denominated debt more difficult to repay, while foreign and local currency borrowing rates have increased as investors become more sceptical about the most vulnerable issuers. International reserves decline as the crisis wears on and sources of FX revenues and capital inflows dry, threatening countries’ capacities to source  and repay external loans. With these risks to remain significant over the course of 2020, a lens on economies especially vulnerable to sudden deterioration in external trading and financial conditions is warranted.

In this spirit, this report presents a biennial update on Scope’s external vulnerability and resilience two-axis evaluation framework that assays countries on: i) their respective external vulnerabilities to the onset of balance of payment crises and ii) the extent of their resilience in the event of a balance of payment crisis.

Figure 2: External vulnerability and resilience framework (design)


While external vulnerability assessments and rankings have traditionally centred on emerging markets, Scope notes that external risks are not unique to developing  countries, but rather shared across nations, as evidenced over the European sovereign debt crisis when risks from large current account deficits, increasing Target 2 liabilities and external competitiveness gaps were exposed across peripheral Europe – instigating capital outflows and increases in bond yields. As such, this report is based on assessing a global set of economies – including advanced and emerging.

External vulnerability and resilience framework: global results


Figure 3 (next page) displays the external vulnerability and resilience framework results for 63 countries1. The graph is divided into four quadrants: Quadrant I. countries that are vulnerable and not resilient to external shocks; II. countries that are not vulnerable to external shocks but also not resilient; III. those that not vulnerable to and resilient in the advent of a crisis; and IV. countries that are vulnerable but resilient. The dividing lines between quadrants reflect the median country scores on the vulnerability and resilience axes. Individual country scores and rankings are summarised in Annexes I and II, underlying data is summarised in Annex IIIand the summary of component variables is located in Annex IV.

In considering overall country rankings on the basis of a two-axis framework, we take into account the sum-score of the two axis-level scores.

Scope’s two-axis framework identifies a 2020 “risky-3” of:

1) Georgia
2) Turkey
3) Argentina

These are economies in Quadrant I of Figure 3 that not only show vulnerability to the onset of balance of payment crises but also exhibit prevailing weaknesses in abilities to cope with crisis. Other countries amongst the most at risk in Quadrant I include Ukraine, Colombia, Indonesia, Egypt and Pakistan.

In addition, Scope observes a 2020 “sturdy-3” of economies in:

1) Taiwan
2) China
3) Switzerland

These are countries in Quadrant III of Figure 3 that are not only less vulnerable to the onset of balance of payment crises but are also well positioned to deal with a crisis were one to take place. Thailand, Malta and Singapore are further economies amongst the least at risk.

Furthermore, Quadrant IV portrays a set of countries that are vulnerable to crisis but highly resilient in one, notably incorporating the US, the UK and Japan – reserve currency countries able to bridge global external shocks and paper over prevailing external vulnerabilities through currencies’ safe haven statuses. Russia (BBB/Stable), with much enhanced FX reserve coverage (Figure 4), cushioning vulnerabilities from sharp drops.

Brent crude prices in 2020 to under USD 30 a barrel, alongside Brazil and New Zealand (both unrated) are also Quadrant IV countries.

Scores for major Western countries vary. As noted, the United States is in Quadrant IV of Figure 3 as the 20th most vulnerable (of 63 nations) to external crises – in view of a significant current account deficit of 2.3% of GDP in 2019 (moreover the world’s largest current account deficit in nominal dollar terms), however anchored by the fourth highest resilience score in the 63 country-set, related to dollar primacy and limited foreign currency debt. Germany ranks strongly overall as the 7th least vulnerable economy – boosted by a 2019 current account surplus of 7.8% of GDP alongside a strong net international investment asset position – but Germany has only middling scores on resilience owing in part to high non-resident holdings of German government bonds. France is mid-table as the 33rd most vulnerable economy but 23rd most resilient. Italy is only the 41st most vulnerable, weakened though by capital outflows of recent years, but receives a very strong resilience mark (11th most resilient), helped by not only the euro reserve currency but also a high share of Italy’s government debt held domestically (almost 70% as of Q2 2019). Spain is a Quadrant I economy and receives a weak overall score – as the 17th most vulnerable economy, weakened by net international investment liabilities of 78% of GDP as of Q3 2019, alongside receiving the 24th poorest mark on external resilience due to high non-resident holdings of government debt and significant foreign-currency-denominated lending in the Spanish banking system.

Among Scandinavian economies – Sweden, Norway and Denmark (all rated AAA/Stable) receive strong scores, with healthy current accounts and robust net international investment positions (NIIPs), as well as developed-market, safe-haven currencies.

The UK ranks as the 9th most vulnerable economy (a modest improvement from 8th most vulnerable in the 2018 report), but nonetheless weighed upon by a wide current account deficit (of 3.8% of GDP in 2019), and sterling volatility in recent years related to Brexit uncertainties. While the UK’s resilience mark is bolstered by sterling’s reserve currency status (4.6% of all global allocated reserves were held in sterling in Q4 2019), the UK ranks overall as only the 25th most resilient country, weakened by high foreign-currency lending in the City of London.

Scope’s Risky-3 in more detail


We next discuss the 2020 risky-3 of Georgia, Turkey and Argentina, as well as Ukraine (as the fourth weakest country in the 2020 rankings) in greater detail.

As was the case in the 2018 update, the weakest country in the 2020 report is Georgia (BB/Negative). Georgia displays high external vulnerability and low resilience to balance of payment crises. The economy has displayed elevated current account deficits, reflecting high investment needs of a developing economy with inadequate domestic savings, a narrow export base, and a dependence on goods imports. The current account deficit has, however, declined from -6.8% of GDP in 2018 to -5.1% in 2019 and has been, moreover, predominantly financed over the last decade by more reliable foreign direct investment (FDI) flows. Nevertheless, Georgia’s small, open economy depends on external financing, as reflected in a large, negative NIIP, amounting to USD 23.8bn or -135% of GDP as of Q4 2019 – a core driver of the weak vulnerability score, alongside the Georgian lari’s volatility in recent years.

External public sector debt, amounting to around 80% of total public debt (with total public debt of 41.4% of GDP in 2019), is denominated in foreign currency (mostly in US dollars or euros), leaving the government balance sheet vulnerable to significant exchange rate fluctuations. Moreover, 58% of government debt does represent concessional multilateral loans, and an ongoing IMF Extended Fund Facility programme institutes a buffer against balance of payment disturbances over the programme duration to April 2021.

While foreign currency transactions inside the Georgian banking sector have declined through the proactive actions taken by authorities in recent years, the level of FX lending and deposits nonetheless remains very elevated at 55% of all loans and 62% of all deposits (mostly in US dollars and euros). FX reserves stood at USD 3.2bn as of March 2020, down slightly compared with USD 3.3bn in March 2019. While reserves’ coverage level of short-term external debt had previously improved, it remains below an IMF adequacy threshold of 100%.

Turkey (BB-/Negative) remains a member of the risky-3 in this year’s list. The Turkish lira is 27% weaker compared with recent August 2019 peaks vs the dollar (trading near 7 against the dollar), which represents a dilemma given 52% of central government debt denominated in foreign currency (meaning FX devaluation automatically feeds through to impairment of public debt serviceability) alongside a significant private sector net FX debt position, which, while cut from February 2018 peaks of USD 223bn, totalled nonetheless USD 175bn as of January 2020. In addition, non-residents hold 39% of Turkey’s government debt.

In data through March, past improvements in Turkey’s trade balance had sharply reversed since 2019 – with much wider recent monthly trade deficits. Official reserves declined to USD 89bn as of 10 April, compared with a 2013 peak of USD 135bn, while – netting out Turkey’s short-term FX borrowings – official net international reserves had declined to USD 26.3bn as of 10 April, from USD 41.1bn at end-2019. Weakened FX reserves mean Turkey is less resilient should capital outflows escalate – and will be an area requiring constant monitoring going forward. Turkey has rejected suggestions of turning to the IMF for support over this crisis.

External sector risks in Turkey are also exacerbated by mismanagement of the economy, in part due to ongoing consolidation of power in the hands of President Recep Tayyip Erdoğan. The policy one-week repo rate has been reduced to 9.75% (from 24% as recently as July 2019) – partly under suspected political influence, resulting in a negative real policy rate in view of March inflation of 11.9% YoY. Accommodative monetary policy had brought lira lending to the domestic economy to elevated levels of +19.1% YoY as of March. Such prevailing macro-economic imbalances sap foreign investor confidence especially in moments of weakness in global sentiment, making Turkey more susceptible to capital outflows that drain reserve stocks, weaken the currency and inhibit the economy. Turkey (BB-/Negative) is the lowest rated issuer in Scope’s rated sovereign universe.

Argentina rounds out Scope’s 2020 risky-3, performing weakly on both assessment axes. Argentina’s public debt increased to nearly 90% of GDP at end-2019, from 56% in 2017, with around 53% of public debt denominated in US dollars. Amid a deep recession in 2020 – exacerbated by nationwide lockdowns since 20 March to impede a coronavirus outbreak in Argentina – President Alberto Fernández announced on 5 April that the government will suspend payments on foreign-currency securities issued in the domestic market for potentially the remainder of 2020 to save remaining resources to support the economy – sliding the government back into selective default – while restructuring talks continue on the side-lines over USD 69bn in foreign-law debt.

Since July 2019 peaks, the Argentine peso has depreciated around 37% against the US dollar and international reserves have dropped by USD 24bn to USD 43.6bn as of March 2020.

Argentina’s private sector is exposed to currency fluctuations in view of elevated foreign- currency-denominated loans outstanding, accounting for 23% of total bank loans.

Moving just off this year’s risky-3 is Ukraine, displayed in Figure 3’s Quadrant I. Ukraine needs to repay around USD 10.7bn in dollar debt over 2020-21, which is significant relative to FX reserves of only USD 23.6bn as of March 2020 (FX reserves have nonetheless increased compared with March 2019 levels of USD 19.6bn). Inadequate FX reserve coverage represents a core danger to Ukraine’s resilience in external crises. Against this backdrop, a continued commitment to reform and cooperation with international financial institutions are keys to maintaining external debt sustainability. The IMF and Ukrainian authorities reached agreement on a new three-year Extended Fund Facility programme of USD 5.5bn in December, which will replace the 14-month Stand-By Arrangement of USD 3.9bn approved in December 2018.

Scope’s Sturdy-3 in more detail


The sturdy-3 represents three economies with the lowest levels of external risk: Taiwan (unrated), China (A+/Negative) and Switzerland (AAA/Stable) – each displaying limited external vulnerability and greater resilience in the event of an external shock.

Taiwan is this year’s most robust economy to external sector risks. Taiwan’s low vulnerability is helped by a very large current account surplus of 10.6% of GDP in 2019. In addition, low volatility of the Taiwan new dollar and a large net international asset position (Figure 6) support vulnerability marks. On resilience, Taiwan’s scores are secured by a robust 2.7x reserve coverage of short-term external debt, low non-resident holdings of government debt, a lack of FX debt in overall government debt and low foreign currency loans in the domestic banking system (with FX loans totalling only 5% of GDP). Taiwan has been one of the most successful countries to date with respect to government mitigation actions in response to the Covid-19 crisis, including aggressive containment, quarantine, and monitoring measures that started early on (in December 2019), creating a response framework for emulation elsewhere in the world. Supported by this, the Taiwan dollar has been stable through this crisis.

China maintains its placement within the sturdy-3 in 2020 with the second strongest overall score in this year’s rankings. This includes status as the most resilient economy in the 63-country sample to external stress factors (up from 3rd most resilient in the 2018 report) alongside 12th least vulnerable of 63 economies (up from 19th). China’s foreign currency reserve stock of USD 3.06trn – by some distance the world’s largest nominal reserve stock – represents 26% of all global FX reserves, presenting the People’s Bank  of China an abundant resource to preserve macro-economic stability and stem balance- of-payment issues. This is even though FX reserve levels declined sharply in March amid global economic stress and remain well off 2014 peaks of USD 3.99trn. Strong reserve adequacy bolsters China’s external resilience, a key credit strength considered in China’s A+/Negative sovereign ratings.

The increased use of the renminbi in the global economy enhances China’s significant external strength. The internationalisation of the renminbi has in the past seen its inclusion in the IMF’s Special Drawing Rights basket of currencies (of five currencies) since October 2016 and the establishment of a new renminbi-denominated Shanghai oil futures market in March 2018. Presently, the share of yuan claims in total global FX reserves stands at 2.0% as of Q4 2019, double the 1.1% as of Q2 2017.

The supervision of China’s financial system remains in a transition stage and the capital account remains largely closed (although gradually opening up), with investors in China’s onshore bond market still predominantly being domestic institutions. Foreign currency denominated government debt amounts to only 2.4% of general government revenues (although foreign currency borrowing is increasing). While China’s comparatively closed, mostly renminbi-premised financial system shields the government from global financial volatility, increased opening to foreign investors and rising demand for foreign currency borrowing from domestic institutions might lower this resilience in the future.

China’s net international investment position peaked in 2007 (at 33.4% of GDP) and has dropped to a still robust +15% of GDP as of Q4 2019. The current account balance has dropped from a peak surplus of 9.9% of GDP in 2007 to 1.0% in 2019, weighed upon moreover by trade conflicts with the United States, higher tariffs on Chinese goods and tariff impacts on export volumes. While reductions in China’s current account support global rebalancing and reduce global risks, a nearly balanced Chinese current account represents a major change in the global economy as China posted the world’s largest nominal current account surplus as recently as in 2015.

However, slower economic growth this year due to the Covid-19 pandemic – which we estimate at about 4% in China with significant downside risk (China grows, for example, only 2% under one alternative scenario) – may nonetheless endanger ambitious goals of purchases of an extra USD 200bn of US goods over the next two years as part of the phase-one trade compromise with the United States and has contributed to weakening the yuan, which now trades above 7 to the dollar. Such events could risk that an unpredictable US government might re-visit the trade truce – which, if so, could test China’s external resilience. Higher capital outflows since H2-2018 are another relevant risk area to track.

Switzerland maintains its role within Scope’s sturdy-3 in 2020 (though falling from the #1 overall rank), ranking as the second least vulnerable economy of 63 countries (down one spot from first in 2018) and the 20th most resilient (up one rank). Since 1981, Switzerland has persistently generated large current account surpluses, which have averaged almost 10% of GDP since 2015, underpinned by the high competitiveness of its exporting sector alongside a large portion of fairly price-insensitive export products, such as in pharmaceuticals. This has helped shape a prodigious net international asset position of 116.2% of GDP at end-2019. Switzerland’s economic resilience to international shocks, including to the 2020 corona crisis (even as cases and mortalities in Switzerland have increased significantly), is supported by the franc’s reserve-currency status and highly liquid capital markets that provide unabated access to liquidity in times of international financial market volatility.
Switzerland’s high national savings, totalling 33% of GDP, support a predominantly resident holding of the country’s government debt, at over 85% ownership of the total. Foreign exposures (claims) of Swiss banks fell steadily after the global financial crisis to USD 1.08trn in Q3 2019 (from USD 2.66trn in Q2 2007). However, a sizeable share of loans denominated in foreign currency (around 40% of total loans) weakens Switzerland’s resilience score.

Most and least at-risk countries in the EU-27


Figure 7: 2020 EU risky-3 and sturdy-3

Top 3 strongest


Top 3 weakest


1Of the 27 EU member states. 2Change in axis rank since 2018 update adjusting the 2018 results to exclude the
UK from EU rankings (to have a like-for-like comparison).

In the EU, among the least vulnerable countries to external shocks include an EU sturdy- 3 of:

1) Malta
2) Luxembourg
3) Denmark

In addition, Italy, Estonia, Belgium and Germany score well. For Malta, Luxembourg, Denmark and Germany, large positive net external financial assets (with an average NIIP of +66% of GDP in 2019), sustained current account surpluses that averaged 7.5% of GDP in 2019, as well as strong safe haven currencies (in the euro and the Danish krone), liquid capital markets and moderate levels of public debt underpin external positions.

On the other hand, the three most at risk member states of the EU (Figure 7, previous page) are:

1) Cyprus
2) Croatia
3) Romania

Cyprus (BBB-/Stable) is displayed in Quadrant I in Figure 8; Croatia (BBB-/Stable) and Romania (BBB-/Negative) in Quadrant II. Hungary drops off the EU risky-3 roster in this year’s report, with Cyprus taking its place. Greece (BB/Positive), Spain (A-/Stable) and Poland (A+/Stable) represent three other EU countries with comparatively high vulnerabilities to external shocks.


The EU Risky-3 in detail


Cyprus leads the EU risky-3. Cyprus’s current account deficit widened to 6.7% of GDP in 2019, from 4.4% of GDP in 2018. The economy’s external position is characterised by high deficits in its trade in goods (21.5% of GDP in 2019), offset by very high surpluses in services trade (21.3% of GDP), the latter due to Cyprus’s standing in tourism services and as a financial services hub. Nonetheless, current account deficits have resulted in one of the largest negative NIIP levels among EU economies at -116%, alongside very high gross external debt levels of 936% of GDP in Q4 2019, which, nonetheless, still represent deleveraging against a 2015 peak at 1,263% of GDP. In addition, well above 70% of government debt is held by non-residents (Figure 9, next page).

We, however, note that special purpose entities (SPEs) in Cyprus considerably distort the economy’s external position while having limited links to real economic activity: excluding SPEs, the NIIP and gross external debt were more modest at -34.3% of GDP and 262% of GDP respectively as of Q3 2019, even if nonetheless still worse than the euro area average. Importantly, Cyprus benefits from euro area membership, unlike in the cases of peers in the 2020 EU risky-3: Croatia and Romania, giving Cyprus access to credit strengths in crisis moments such as reduced FX volatility and capped borrowing rates deriving from the common reserve currency.

Croatia stands out as a Quadrant II economy in Figures 2 and 8, a characteristic shared, for instance, by Bulgaria (BBB+/Stable). Croatia and Bulgaria are economies with lesser balance of payment vulnerabilities but also less resilient than most nations were a balance of payment crisis to nonetheless occur. As such, while risks for a balance of payment crisis might be lower than in most countries with both economies holding current account surpluses alongside successful, long-standing fixed or managed floating exchange rate regimes against the euro, resilience in a currency crisis, however unlikely, would be more subject to question, with both economies highly euroised – meaning any break in Croatian kuna or Bulgarian lev exchange rates against the euro could threaten financial stability.

Croatia is the 4th least vulnerable economy in the EU (and 10th least vulnerable overall in the 63-country set) but is the EU economy with the weakest scores on external resilience (and 2nd least resilient overall of 63). Croatia’s current account surpluses have averaged over 2% of GDP over the past two years, driven by large surpluses in services trade, while goods trade has been in deficit. Current account surpluses have helped to curtail Croatia’s negative NIIP to -50.8% of GDP as of Q4 2019, from -65.6% in Q3 2017.

Any unforeseen depreciation in the kuna would adversely impact government and private sector balance sheets by raising the value of foreign-currency debt in local currency terms, with 51% of private sector loans and almost 70% of government debt denominated in foreign currency. Croatia’s (as well as Bulgaria’s) resilience to short-term external shocks will be materially enhanced after the countries join the EU's Exchange Rate Mechanism II (ERM II) and, eventually, adopt the euro, a process which both countries are making important progress towards.

Romania remains in the 2020 EU risky-3 as an economy in Quadrant II of Figure 8. Romania’s current account deficit widened modestly to 4.7% of GDP in 2019, from 4.4% in 2018. The current account is expected to remain below -5% of GDP over the 2020-21 period. A high share of foreign-currency-denominated public debt (amounting to 18% of 2019 GDP) and widening fiscal deficits constitute significant risks to Romania’s debt sustainability. The country’s negative NIIP was relatively unchanged at -43.5% of GDP in 2019. Romania’s external sector competitiveness remains a weakness due to high inflation, which is only partly compensated for by depreciation in the Romanian leu.


Annex II: Country external vulnerability score (sorted by rank) and resilience score (sorted by rank)

Source: Scope Ratings GmbH

Source: Scope Ratings GmbH

Annex III: Vulnerability/resilience grid by components, hard figures (sorted by world region)

Source: IMF, Eurostat, BIS, Bloomberg, JP Morgan, national central banks, national statistical offices, ministries of finance, Haver Analytics, Scope Ratings GmbH; *for Venezuela and Vietnam, the data is equal to (total reserves - total external debt) as a % of GDP; **for countries not covered by BIS, data is calculated by multiplying their GDP share in the world by the BIS OTC turnover for residual currencies; ***for Belgium and Japan, data equals foreign-currency-denominated deposits, % GDP.

Annex IV: Indicator definitions and rationale


*The exception is for euro area countries, which receive a fixed score of 7.5 on the resilience against currency crises variable, owing to a lack of currency adjustment flexibility in the event of balance of payment issues (from being in a currency union). This is despite having a strong reserve currency in the euro.