Показаны сообщения с ярлыком 2016. Показать все сообщения

суббота, 15 июля 2017 г.

Which Pharma Executive Made the Most Money Last Year?


Tracking executive pay follows a familiar pattern: Collect compensation disclosures, read said documents as they pile up, and when the usual suspects have all filed their annual reports and proxy statements, put the numbers into a spreadsheet and sort descending.

It’s pretty much guaranteed Johnson & Johnson’s CEO will be near the top of the list, regardless who’s in the job. Same for Abbott Laboratories—until it spun off its pharma business, AbbVie, whose CEO is now a regular. Same for Bristol-Myers Squibb—from Jim Cornelius to Lamberto Andreotti and now Giovanni Caforio, M.D.

What’s not guaranteed is that the chairman of a generics maker in hot water with the U.S. government and American parents—Mylan’s Robert Coury—would step off the company’s employee roster and into the nonexecutive chairman’s job and reap a $97 million package with the move.

пятница, 7 июля 2017 г.

The 20 biotech companies with the best reputations as employers

The 20 companies with the best reputations as employers and the top three driving characteristics for each company, according to respondents in the 2016 survey undertaken for the Science/AAAS Custom Publishing Office.


среда, 25 января 2017 г.

World’s Top 15 Biotech Companies 2016


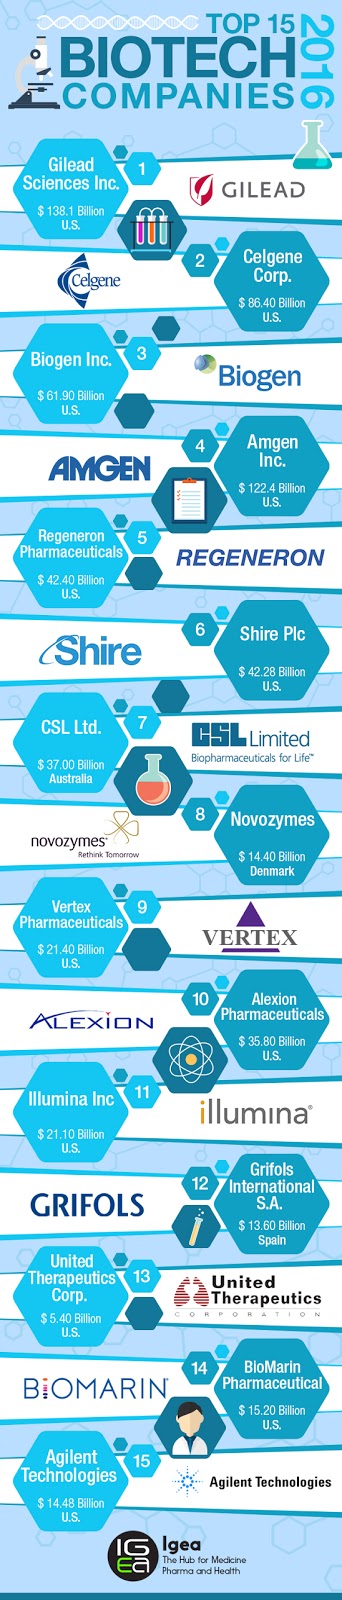
THE GLOBAL BIOTECHNOLOGY MARKET WAS ESTIMATED TO BE USD 330.3 BILLION IN 2015. THE MARKET IS GROWING AND THE TOP-15 BIOTECHNOLOGY PLAYERS ACCOUNT FOR A MARKET SHARE OF ~33% IN 2015. THESE ORGANIZATIONS ARE PRIMARILY LOCATED IN U.S. AND EUROPE. A COMPARATIVE ANALYSIS OF THE TOP 15 BIOTECHNOLOGY PLAYERS WAS DEVISED TO DEVELOP A RANKING FOR THESE ORGANIZATIONS. THE MODEL INCORPORATED EIGHT CRITERIA INCLUDING REVENUE, REVENUE GROWTH, OPERATING EXPENSE RATIO, INCOME PER SHARE, R&D BY SALES RATIO, INCOME PER EMPLOYEE, MARKET CAP AND ASSET TURNOVER RATIO. STATISTICAL SCORING WAS CONDUCTED BASED ON THESE CRITERIA TO ARRIVE AT THE FINAL SCORE BASED ON WHICH RANKS WERE DEVELOPED.

Analysis of top-15 biotechnology companies:
tableSources: SEC filings, annual reports, Genetic Engineering & Biotechnology News and Forbes Media.
  1. GILEAD SCIENCES INC. (U.S.)

Gilead is the top-ranked company in this list. The organization had highest revenues of USD 32,639 million in 2015. Income per share and income per employee is one of the highest for the company. Gilead also tops the market cap list in 2015. The operating expense ratio of the company is one of the lowest in 2015. The company manufactures research-based biopharmaceuticals with focus on human immunodeficiency virus (HIV), liver diseases such as chronic hepatitis C virus (HCV) infection and chronic hepatitis B virus (HBV) infection, oncology and inflammation, and serious cardiovascular and respiratory conditions.
  1. CELGENE CORP. (U.S.)

Celgene ranks second in the list owing to its large revenue and high market cap. Another significant reason is the allocation of the high R&D budget in 2015. The company is engaged in the discovery, development and commercialization of therapies and treatment of cancer and inflammatory diseases through gene and protein regulation.
  1. BIOGEN INC. (U.S.)

Biogen is the one of the largest company in terms of revenue and income per share in 2015. The company had asset turnover ratio of 55.20% in 2015. Biogen develops, markets and manufactures therapies for neurological, autoimmune and hematologic disorders.
  1. AMGEN INC. (U.S.)

Amgen accounts for the second-largest revenue share of USD 21,662 million in 2015. The company’s income per share value was USD 9.15 in 2015. Amgen had one of the highest asset per share value in 2015. The primarily focus of the company is human therapeutics based on cellular and molecular biology.
  1. REGENERON PHARMACEUTICALS, INC. (U.S.)

The revenue growth from 2014 to 2015 was 45.5% for Regeneron in 2015. The company also had one of the highest asset turnovers in 2015. The company is active in biopharmaceutical products marketing for eye diseases, colorectal cancer and a rare inflammatory conditions.
  1. SHIRE, PLC (U.S.)

Shire had revenue of USD 6,416.70 million in 2015. The company had one of the lowest revenue growth of 6.5% from 2014 to 2015. The operating expense ratio was among the highest for the company calculated at 77.8%. The company focuses on therapies for rare diseases.
  1. CSL LTD. (AUSTRALIA)

Australia-based company, CSL Ltd. accounts for one of the lowest operating expenses ratio at 27.98%. The asset turnover ratio of the company is the highest in 2015 and stands at 81.72%. The company develops, manufactures and markets vaccines, in vitro diagnostic products and plasma protein biotherapies.
  1. NOVOZYME (DENMARK)

Novozyme is a Denmark based company and accounted for 95.1% of research and development to sales ratio in 2015. The company had one of the lowest income per employee in 2015. The company develops and produces industrial enzymes, microorganisms, and biopharmaceutical ingredients.
  1. VERTEX PHARMACEUTICALS INC. (U.S.)

Vertex’s revenue for 2015 was one of the lowest but the company tops the list in revenue growth from 2014 to 2015 at 77.86%. The company had highest operating expense ratio at 145% resulting in low revenues. Furthermore, the company accounted for the highest R&D expenditure to sales ratio in 2015, measured at 96%. Vertex develops clinical development programs focused on cystic fibrosis, and has more than dozen ongoing research programs aimed life-threatening diseases.
  1. ALEXION PHARMACEUTICALS INC. (U.S.)

The revenue for Alexion was USD 2,604.05 million in 2015. The company has lowest asset turnover ratio and one of the lowest income per share in 2015. The company had developed therapies for treatment of paroxysmal nocturnal hemoglobinuria and atypical hemolytic uremic syndrome and aims to develop enzyme replacement therapies for rare disorders.
  1. ILLUMINA, INC. (U.S.)

Illumina’s revenues in 2015 were valued at USD 2,219.76 million. The company had one of the lowest expense ratio amongst others in 2015. Illumina develops, manufactures and markets systems for the analysis of genetic variation and function. It also provides sequencing and array-based solutions for genetic analysis, genotyping and whole-genome sequencing services.
  1. GRIFOLS INTERNATIONAL, S.A. (SPAIN)

The revenue for the Spanish company was USD 4,167.88 million in 2015. Grifols had the lowest operating expense ratio in 2015, calculated at 24.6%. The company ranks 12th in the list owing to lowest R&D by sales ratio and income per employee in 2015. The company produces a variety of plasma derivatives.
  1. UNITED THERAPEUTICS CORP. (U.S.)

United Therapeutics revenue was USD 1,465.76 million in 2015. The company had the lowest market cap in 2015. The company tops the list in income per employee category valued at USD 9.16 million. The company in engaged in development and commercialization of cardiovascular and infectious diseases and cancer treatment products.
  1. BIOMARIN PHARMACEUTICAL INC. (U.S.)

BioMarine accounts for the lowest revenues and income (loss) per share value at USD 889.90 million and USD -1.07 in 2015. The company has one of the highest operating expense and lowest asset turnover ratios on 2015. BioMarine commercializes and produce therapies for mucopolysaccharidosis type I (MPS I) and phenylketonuria.
  1. AGILENT TECHNOLOGIES (U.S.)

Agilent Technologies ranks lowest in the list owing to decline in revenue growth rate from 2014 to 2015. The company also had one of the lowest research and development budgets in 2015. Agilent is active in life sciences and diagnostics research in the field of cancer, cardiovascular diseases, diabetes, Alzheimer’s, Parkinson’s, and autism amongst others.

понедельник, 23 января 2017 г.

Where the money is, 2016 edition: The top 100 VCs investing in biotech, by the numbers

Using the lat­est set of num­bers on the top 100 VCs op­er­at­ing in the US, you can sketch out all of the big trends at play in the multi­bil­lion-dol­lar game of biotech in­vest­ing and star­tups.

David Mott, NEA

The top four VCs — Flag­ship, Third Rock, New En­ter­prise As­so­ci­ates and Arch Ven­ture — all en­tered 2016 flush with cash and ready to start ramp­ing up new com­pa­nies while fos­ter­ing the up­starts al­ready in their port­fo­lios, ac­cord­ing to fig­ures Thom­son Reuters pro­vided to End­points News. NEA may have slipped down the list a bit, but the life sci­ences group under David Mott con­tin­ues to be one of the most pro­lific in the in­dus­try, not shy in the least to take a lead role in big new rounds.
In many cases, these four VCs have been kick­start­ing com­pa­nies into ex­is­tence using a blank-slate ap­proach in track­ing down and spark­ing the shift from acad­e­mia into the clinic. And groups like Atlas and 5AM have been close be­hind.
If you ranked these firms by the num­ber of deals, Po­laris would come in at the top (same as last year) though they are clearly look­ing at mak­ing smaller bets across a wider slate of can­di­dates.


Third Rock Ven­tures

Most of these top play­ers are keenly in­ter­ested in the ear­li­est stages of in­vest­ing in biotech, but the un­der­tow on the money is also in­evitably broad­en­ing to in­clude later stages of work, which is why Flag­ship re­cently added a new $285 mil­lion fund to ex­tend its reach fur­ther down the clinic.
With IPOs suf­fer­ing last year, it’s also no sur­prise to see a crossover in­vestor like RA Cap­i­tal drop from 5th in 2015 to 56th in 2016. But Or­biMed and Deer­field re­main in the top tier of the busiest play­ers.
The num­ber of new deals has slipped, which is also no sur­prise. 2015 re­mains a record year in ven­ture in­vest­ing that will be hard to beat in the com­ing years, as VCs wait out the lull in the pub­lic mar­ket. But the over­all flow of cash re­mains near enough to his­toric highs to keep the land­scape look­ing bright.
To fully un­der­stand these num­bers, you have to start by clar­i­fy­ing that the to­tals in the amount in­vested col­umn aren’t gospel. Thom­son Reuters gath­ers up all the num­bers it can find — in the news, SEC fil­ings and so on — and then divvies the amount of each round by the num­ber of play­ers on record. If one VC was in­volved in a round, they have a solid fig­ure. If 4 or 5 play­ers are in­volved, they di­vide by the total and use that as the av­er­age. It’s not per­fect, but it does cap­ture the level of ac­tiv­ity each VC is play­ing with.


Po­laris Part­ners

Based on the num­ber of new funds that con­tinue to at­tract record amounts of money for play­ers like Ver­sant, it’s fair to say that 2017 looks solid as we begin the year. Just about every­one ex­pects a re­peat of 2016 on the IPO front, though with Don­ald Trump en­ter­ing the White House as the wild card in Amer­i­can pol­i­tics — stroking cor­po­ra­tions with one hand while slap­ping pharma with the other — who re­ally knows what’s going to hap­pen?
Some­one asked me re­cently where they had the best shot at rais­ing cash for his biotech ven­ture. My sug­ges­tion: Look over the num­bers and deals in your own sec­tor and see who has a track record in your field. And this is a good place to get started on that ex­er­cise.


Table
Top 100 VC firms in­vest­ing in U.S. biotech com­pa­nies
Based on all known 2016 deals

Firm
# Deals
# of Com­pa­nies
Avg Eq­uity/Deal ($M)
Avg Eq­uity/Com­pany ($M)
Total Eq­uity In­vested
1
12
9
21.82
29.09
261.83
2
14
11
12.18
15.51
170.57
3
22
21
6.64
6.96
146.11
4
17
15
7.72
8.75
131.18
5
10
8
11.88
14.85
118.78
6
14
14
8.25
8.25
115.51
7
15
14
6.99
7.48
104.79
8
13
13
7.11
7.11
92.42
9
1
1
92.00
92.00
92.00
10
21
15
4.31
6.03
90.47
11
5
5
16.79
16.79
83.95
12
8
7
10.33
11.80
82.63
13
4
4
19.98
19.98
79.93
14
20
17
4.00
4.70
79.90
15
23
21
3.30
3.61
75.82
16
14
12
4.83
5.63
67.56
17
3
3
22.14
22.14
66.42
18
5
4
12.40
15.50
62.01
19
1
1
61.45
61.45
61.45
20
1
1
55.00
55.00
55.00
21
7
7
7.60
7.60
53.19
22
10
10
5.17
5.17
51.68
23
13
11
3.86
4.57
50.23
24
7
7
7.17
7.17
50.17
25
6
6
8.30
8.30
49.81
26
4
4
12.23
12.23
48.91
27
1
1
48.00
48.00
48.00
28
9
8
5.21
5.86
46.90
29
7
6
6.54
7.63
45.80
30
2
2
21.95
21.95
43.91
31
12
12
3.53
3.53
42.33
32
4
4
10.38
10.38
41.51
33
7
7
5.66
5.66
39.61
34
2
2
19.75
19.75
39.50
35
9
8
4.21
4.74
37.93
36
8
7
4.72
5.40
37.77
37
3
3
12.18
12.18
36.53
38
8
8
4.34
4.34
34.72
39
6
5
5.55
6.66
33.31
40
2
2
16.50
16.50
33.00
41
7
7
4.67
4.67
32.72
42
1
1
32.33
32.33
32.33
43
4
4
7.93
7.93
31.71
44
8
8
3.90
3.90
31.21
45
10
9
3.01
3.34
30.05
46
4
4
7.44
7.44
29.75
47
10
9
2.97
3.30
29.66
48
9
9
3.25
3.25
29.28
49
5
5
5.54
5.54
27.70
50
5
4
5.54
6.93
27.70
51
2
2
13.46
13.46
26.92
52
2
2
13.40
13.40
26.80
53
2
2
13.04
13.04
26.07
54
3
3
8.17
8.17
24.51
55
4
4
6.11
6.11
24.45
56
6
6
3.86
3.86
23.19
57
4
4
5.70
5.70
22.79
58
6
5
3.78
4.54
22.69
59
10
9
2.20
2.44
21.98
60
3
3
7.27
7.27
21.80
61
5
5
4.35
4.35
21.73
62
4
3
5.17
6.89
20.68
63
2
2
10.31
10.31
20.63
64
2
2
10.06
10.06
20.13
65
3
3
6.71
6.71
20.12
66
7
5
2.85
3.99
19.96
67
6
6
3.27
3.27
19.63
68
4
4
4.82
4.82
19.28
69
6
6
3.13
3.13
18.76
70
2
2
9.31
9.31
18.61
71
6
6
3.08
3.08
18.47
72
3
3
6.15
6.15
18.46
73
2
2
9.21
9.21
18.42
74
1
1
18.31
18.31
18.31
75
5
5
3.53
3.53
17.64
76
3
3
5.66
5.66
16.98
77
3
3
5.66
5.66
16.98
78
4
3
4.04
5.39
16.16
79
2
1
8.04
16.09
16.09
80
2
2
7.95
7.95
15.90
81
2
2
7.94
7.94
15.88
82
2
2
7.86
7.86
15.72
83
2
2
7.84
7.84
15.68
84
2
2
7.63
7.63
15.25
85
3
3
4.95
4.95
14.85
86
2
2
7.23
7.23
14.46
87
1
1
14.35
14.35
14.35
88
3
3
4.72
4.72
14.16
89
2
2
7.06
7.06
14.11
90
2
2
6.92
6.92
13.83
91
1
1
13.75
13.75
13.75
92
1
1
13.75
13.75
13.75
93
4
4
3.42
3.42
13.68
94
2
2
6.79
6.79
13.57
95
3
3
4.52
4.52
13.55
96
2
2
6.65
6.65
13.30
97
3
3
4.43
4.43
13.29
98
2
2
6.62
6.62
13.24
99
1
1
13.05
13.05
13.05
100
4
3
3.23
4.31
12.93