
Facing turbulent and fast-changing markets, innovators need a well-tuned innovation system that can spot emerging product, service, and business model opportunities—and then rapidly develop and successfully scale them—over and over again.
Successful Serial Innovators Get Three Things Right
Successful Innovators Walk the Talk

By Michael Ringel, Ramón Baeza, Rahool Panandiker, and Johann D. Harnoss
In innovation—as in life—drive, size, and skill are a powerful combination. Drive to set an ambitious agenda and fund promising opportunities. Size to transform these opportunities into real sources of new revenue. And the skill, as embodied in a well-tuned innovation system, to be able to do it over and over again.
And the world’s most innovative companies have been getting bigger. The revenue of a typical “small” company on BCG’s 2020 list of the 50 most innovative companies is $30 billion—up more than 170% from $11 billion (in constant dollars) in our first survey in 2005.
But drive and size mean little if your innovation system can’t build on them for serial success. And here our research offers a more sobering assessment. Serial innovation is hard. Of the 162 companies that have been on our top 50 list over the past 14 years, nearly 30% appeared just once—and 57% appeared three times or fewer. Only 8 companies have made the list every year: Alphabet, Amazon, Apple, HP, IBM, Microsoft, Samsung, and Toyota.
When we began the research for this 14th edition of BCG’s Most Innovative Companies report, COVID-19 had not yet emerged. As we explored the data and interacted with clients, however, it became clear that this year’s core findings—about the advantages of scale and the imperative for serial innovation—may be even more relevant today as innovation leaders need to adapt to rapidly shifting patterns of supply, demand, consumer behavior, and ways of doing business.
Moreover, our research has shown that companies doubling down on innovation during downturns—using the opportunity to invest and position for the recovery—outperform over the long term. But doing that successfully requires developing a clear innovation strategy and supporting it with appropriate investment, leveraging the advantages of scale, and ensuring that your innovation system is nimble enough to spot and seize the best opportunities quickly and decisively. As we explore these themes, we draw on our global innovation performance database of more than 1,000 firms to detail the practices that make the best stand out from the rest.
COMMITTING TO INNOVATION
Innovation is a top-three management priority for almost two-thirds of companies. This is the lowest level since the financial crisis in 2009 and 2010—perhaps reflecting the uncertain economic outlook amid geopolitical tensions even before the outbreak of COVID-19.
We can disaggregate our findings further. “Committed innovators” (45% of the total) say that innovation is a top priority, and they support that commitment with significant investment. “Skeptical innovators” (30% of the total) are the reverse, seeing innovation as neither a strategic priority nor a significant target of funding. And “confused innovators” (25% of the total) are in between, with a mismatch between the stated strategic importance of innovation and their level of funding for it. (See Exhibit 1.) We find the highest proportion of committed innovators in the financial and pharmaceutical sectors (both 56%)—and the lowest in industrial goods (37%) and wholesale and retail (32%).

Committed innovators are winning. Almost 60% of them report generating a rising proportion of sales from products and services launched in the past three years, compared with only 30% of the skeptics and 47% of the confused. The skeptics may or may not be making wise strategic decisions—it is sometimes neither strategically sound nor feasible to pursue innovation leadership—but at least they are consistent. The confused are a puzzling lot with a worrying disconnect between strategy and innovation spending.
And winners are more likely to be committed innovators, further evidence of the divide between the best and the rest that we have discussed in the past few innovation reports. In 2019, for example, we found a wide gulf between strong and weak innovators with respect to their use of artificial intelligence (AI). We also discovered that strong innovators were making increasing use of external innovation channels such as incubators and partnerships with academic institutions. Our 2018 research showed that almost 80% of strong innovators have properly digitized innovation processes compared with less than 30% of weak innovators. The relationship between commitment and results is the latest evidence of the strong getting stronger—across a spectrum of innovation-related criteria.
HOW COMMITTED INNOVATORS ARE PLACING THEIR BETS
While many companies struggle to address multiple innovation challenges at once, committed innovators prioritize a handful and as a result address them more effectively. They focus on advanced analytics, digital design, and technology platforms. (See Exhibit 2.) Companies may embrace these enablers for different reasons. Advanced analytics, for example, are a top priority for industrial goods companies that are seeking to develop new analytics-driven value propositions, such as agricultural equipment manufacturers moving into precision farming enabled by the Internet of Things (IoT).
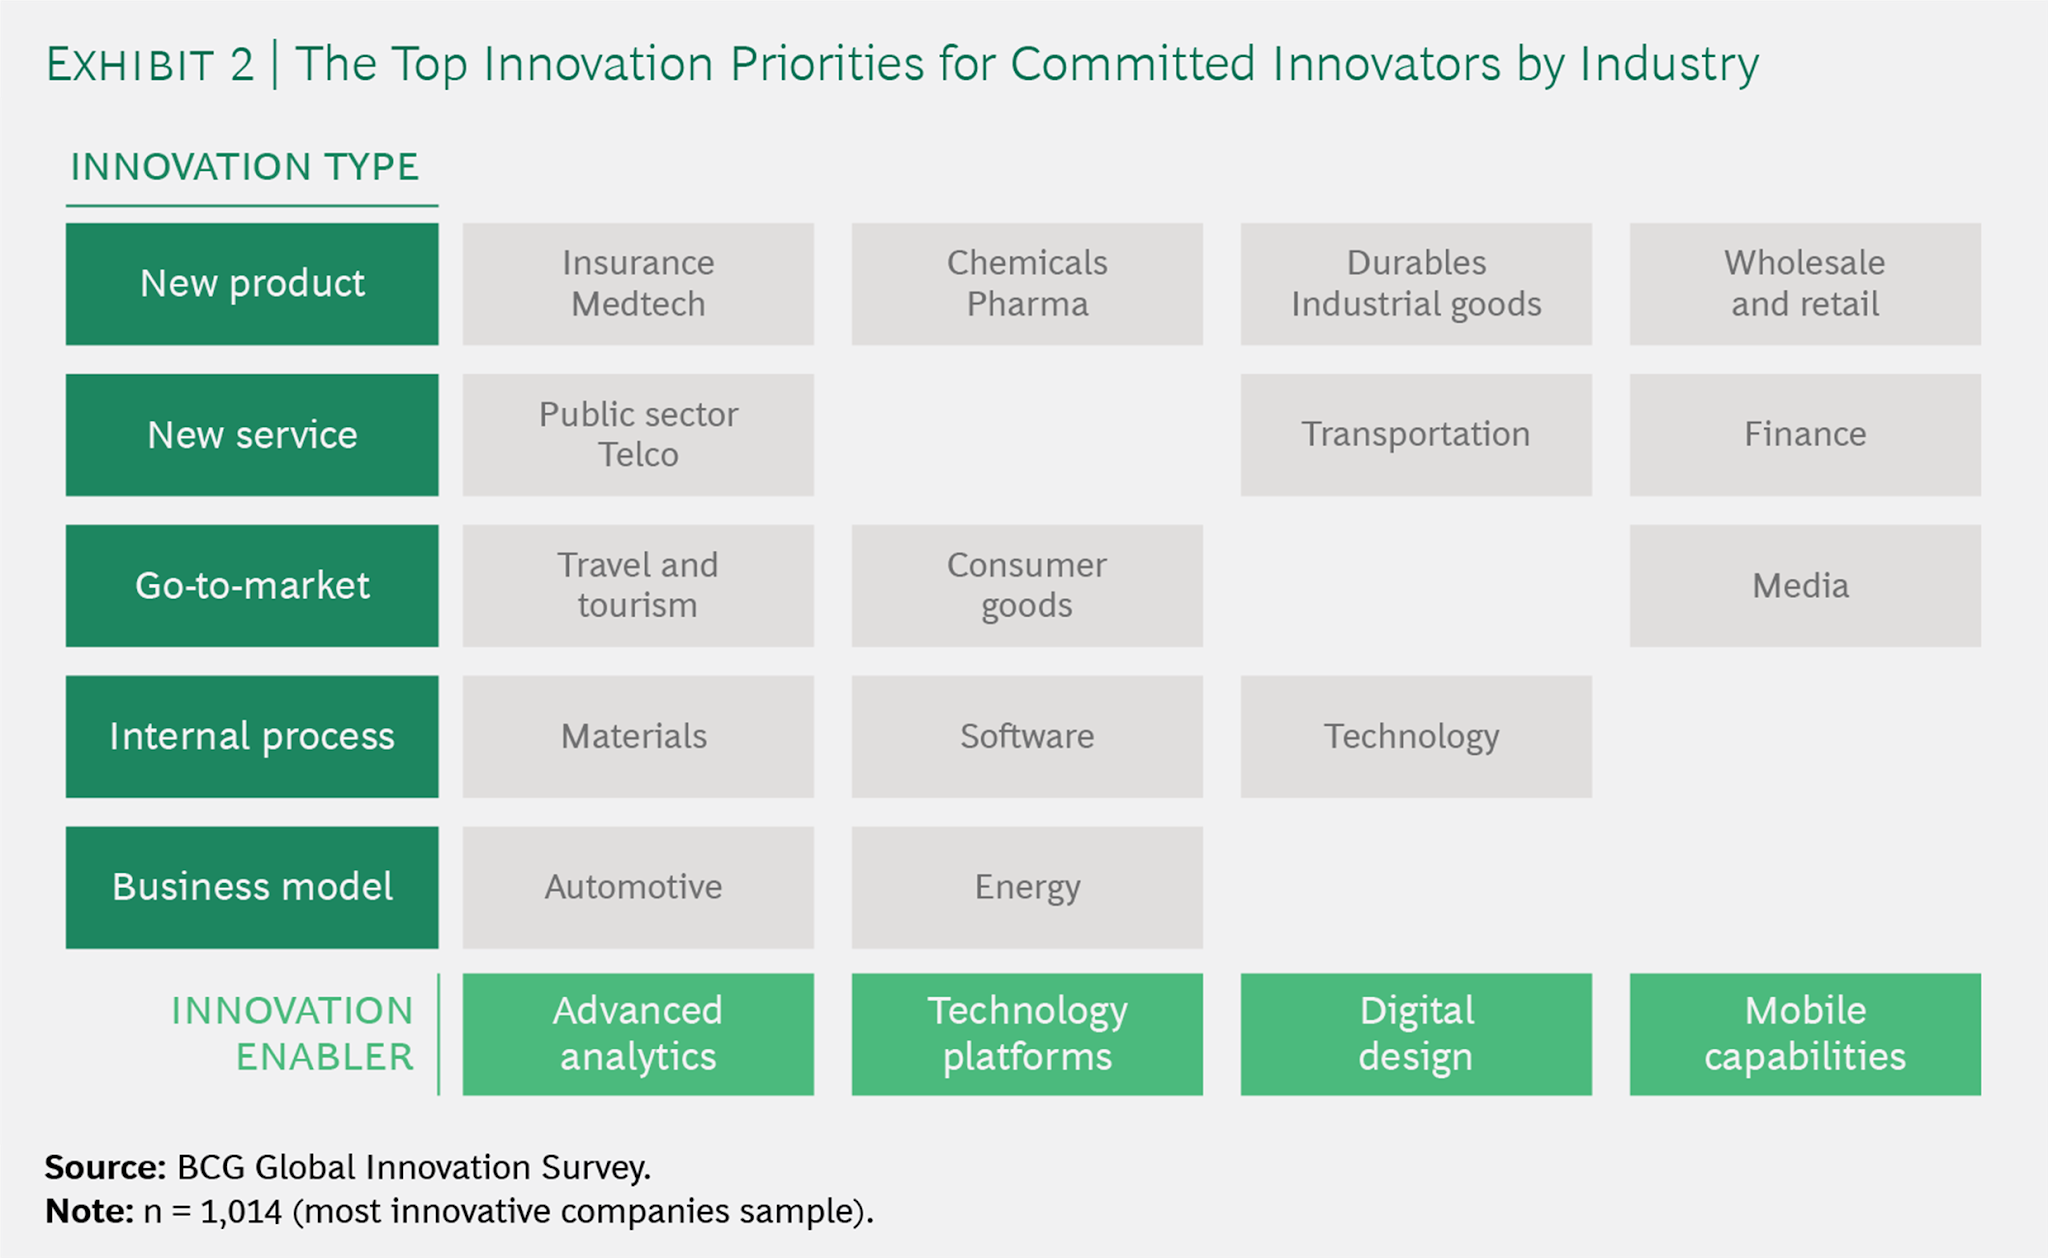
Even among committed innovators, only 60% report success in solving the challenges they prioritize. All companies have plenty of room to improve but doing so may be hampered by the “AI paradox” we pointed to last year—the ease of achieving powerful results with AI pilots and the difficulty of replicating those results at scale. Another issue is the challenge of making success repeatable, establishing a successful serial innovation machine. (See the related article in the 2020 report, “When It Comes to Innovation, Once Is Not Enough”)
Consider the example of Target. The company is making a major push to innovate in its core store-based retail business and achieve synergies between offline and online commerce. Target doubled capital expenditures from 2016 to 2018. The intent is to attract foot traffic by making stores more interactive—for example, customers can better imagine how products fit their homes by using augmented-reality point-of-sale displays. The company also wants to create omnichannel customer journeys so that shoppers can seamlessly move among channels, ordering at home and picking up in stores, for instance. Target’s online sales growth outpaced its competitors in 2019, and in a sector that has been under sustained disruptive attack, it generated 25% annualized TSR for the past three years.
INNOVATION AND DISRUPTION
Since 2015, we have asked executives to name not only the three companies they regard as the top innovators across all industries but also the three most innovative companies in their own industry. This year, we noted a new and surprising pattern: compared with 2015, significantly more respondents named companies traditionally associated with a different industry as a leading innovator in their own industry. Think Amazon in health care or Alibaba in financial services.
In a world where every industry is becoming a technology industry to some degree, this kind of boundary-busting innovation is an increasingly important innovation capability. We have therefore added a new scoring dimension to our most innovative companies ranking methodology that captures each company’s variety and intensity of boundary breaking. Granted, some companies have always been boundary busting. For example, 3M has innovated in multiple industries over the years, including consumer goods, chemicals, manufacturing, and medtech. Yet today, we already see significantly more such activity compared with 2016—an increase of 20%. New players that are active across industry borders and exemplify this trend include firms such as Sony, Nike, Xiaomi, and JD.com.
Looking at the data on the industry level, software and services companies are the ones most frequently cited as entering other sectors—further confirmation (if any is needed) of venture capitalist Marc Andreessen’s 2011 observation that “software is eating the world”—but tech is far from the only cross-industry disruptive innovation force. (See Exhibit 3.) Automakers, chemical companies, retailers, and industrial manufacturers are also playing more and more often in other companies’ sandboxes as they see opportunities for new technology-enabled business models and revenue streams outside their own core businesses.

These disruptors are often orchestrating ecosystems that bring together the capabilities of multiple participants in a new platform or service offering. The auto industry’s shift toward autonomous driving and a mobility model is one prominent example, as demonstrated by Sony, Alphabet, and Apple, as well as automotive companies such as Tesla, Volkswagen, and Bosch.
The IoT and other technologies create opportunities for traditional companies, such as manufacturers, to transform themselves into data-enabled software or service businesses. These companies often play offense and defense simultaneously. Think of the ongoing transformations in the automotive, aircraft, and farm equipment industries, where companies are moving from manufacturing equipment to combining equipment, data, software, and connectivity to provide entirely new types of solutions. The data suggests that successful self-disruptors earned an annual TSR premium of 2.7 percentage points from 2016 to 2019 over companies that focused solely on defending their own turf.
A clear innovation ambition, appropriate resourcing, and the ability to break industry boundaries are not the only prerequisites for innovation success. As we examine in the companion articles that make up this year’s report, winners find a number of ways to differentiate themselves. And large companies are increasingly using size to flex their innovation muscles and may be even more advantaged now than In Innovation, Big Is Back.
2) They Embrace the Benefits of Scale
In Innovation, Big Is Back

Conventional wisdom suggests that when it comes to innovation, small companies have the edge. They are quick and nimble. They have no legacy organizations, technology, or infrastructure to hold them back. Because they are often privately owned, they can play for the longer term. Big companies, by contrast, are weighed down by internal bureaucracy, bound by out-of-date systems and ways of working, and if publicly traded, too focused on the next quarter’s earnings to think about the longer term.
But even before the crisis, the data suggested a more nuanced picture. While smaller companies’ scale makes coordination easier—and helps ensure that they stay closer to customers—our research found that the innovation success rates of smaller companies were not higher in any statistically significant way than those of larger ones. And today, given the greater ability of larger companies to fund investments from their own cash flows, some of them may actually have an edge.
Of course, if size is not an impediment to innovation, it stops being an excuse for underperformance. After all, as we show in a companion article in this year’s report, the most innovative companies in BCG’s annual listing have been getting larger. So what distinguishes the large companies that are innovation winners from the rest?
THE BIG ENGINES THAT CAN
Large companies face a few common obstacles. The top two issues cited by all large firms in our 2020 innovation survey are a lack of discipline in resource allocation, including insufficient rigor in cutting questionable projects while putting muscle behind those with promise (31%), and the difficulty of uniting the organization behind the innovation strategy (27%).
But not all large companies are alike. More than 40% of the big companies (defined as $1 billion or more in revenue) in our 2020 sample overcome these two key obstacles. They fall into the innovation leaders category—that is, they generate a larger percentage of sales from products or services launched within the past three years than their industry median. This compares with on average 50% of the smaller firms surveyed. (See Exhibit 1.) So, smaller companies are more likely to outperform the large firms, but the difference is small in magnitude and not statistically significant.

MORE BANG FOR THE BUCK
Innovation leaders appear to be remarkably alike, regardless of size. Smaller leaders make investments in innovation as a percentage of sales at a similar level as bigger companies. They are equivalent in speed to market and achieve comparable returns. The real distinctions emerge when we look at what distinguishes large leaders from other large firms.
Large innovators that outperform their big-company peers put more money behind their innovation programs—1.4 times more as a percentage of sales—and they get far greater payoffs: four times as much as a percentage of sales. (See Exhibit 2.) Surprisingly, they also take time to get things right, with large leaders reporting average times to market for innovation outside their core that are up to five months longer than the times for others.

OVERCOMING BARRIERS
So among the larger innovators, what are the key differences between the leaders and the laggards? To our surprise, culture does not appear to be one of them. In fact, the cultures of large companies, both leaders and laggards, look very similar. (See Exhibit 3.) Granted, an innovation culture is notoriously hard to describe or assess. Still, the data suggests culture may not be a precondition for, but rather have a correlation with—or even be an outcome of—innovation success.


These differences do not suggest that some strategic choices are better than others. They do spotlight the importance of having an internally consistent systematic approach to innovation.
DESIGNING A WINNING INNOVATION SYSTEM
Deeper analysis of the differences between leaders and laggards in the same industry (as well as BCG’s client experience) points to leaders expanding their advantage in five aspects of their innovation systems. These are talent, ambition, governance, funnel management, and project management.
Our benchmarking database reveals that achieving just one level of improvement on our five-point maturity scale in any one of these five aspects can result in an increase in innovation output (the percentage of sales from products, services, or business models introduced in the past three years) of 0.5 to 0.8 percentage points. A one-level improvement in all five dimensions raises innovation output by 3.4 points—a big yet very much achievable number for any large company.
Inspiring Ambition. Leaders align their innovation ambition with corporate strategy and communicate the connection. The organization has a clear, shared understanding of what it means by “innovation.” Leaders also back their ambition with resource commitments of capital, operating budgets, and staff, as well as top management support. We recently helped a large energy company set its innovation ambition in an iterative process that took into account organic growth expectations and the projected shrinking size of the running business. On that basis, we derived the target growth from innovation and then validated this target with bottom-up growth potentials from different market segments. We then further assessed the resulting ambition against the availability of funds and talent.
One Steering System. Leaders increase their odds of success by establishing good-governance practices and regularly adjusting them as needs change. For example, most large companies now have a varied set of ecosystem partners and vehicles—including internal incubators, venture funds, and accelerators—to accelerate innovation by complementing their in-house development efforts. In practice, these vehicles often overlap in scope, undermining their effectiveness. We observed this dynamic at a global manufacturing company that had various vehicles with overlapping mandates, creating competitive tensions and leading to disconnects with the core business. The company corrected these overlaps by setting up a coherent steering system with specific roles and success metrics for each vehicle.
Talent First. Leaders work toward making their innovation teams go-to destinations for internal and external talent. They devote resources to attracting, training, and retaining the best people they can find—often prioritizing those with entrepreneurial experience. Yet what really drives performance, in our view, is their ability to allocate their best internal talent to innovation teams. One medtech company elevated the role of head of R&D to chief technology officer (a board-level position), trained technical managers in business so that they could become product owners capable of leading cross-functional teams, and now delivers more new digitally enabled solutions than ever.
Portfolio Mindset. Leaders pay close attention to the shape and quality of their innovation funnel—and the processes to manage it. Not surprisingly, leaders tend to have broader funnels: they have the capacity to generate more potentially valuable ideas and convert their best ideas into scalable products or services. Funnel management ultimately comes down to the quality of decision making in a few critical go or no-go decisions, as well as the ability to take both a project and a portfolio perspective at the same time. Winners create the context for better decision making by establishing a focused set of tools and criteria for making the right call, ensuring the ideal balance between hands-off and hands-on involvement, and setting the right incentives, such as not penalizing innovation teams for flagging issues or even recommending a late project pivot.
What’s more, leaders consistently run postmortem analyses to make sure that they learn from mistakes. The best innovators do this not only for failed projects but also for funding decisions that, with the benefit of hindsight, look like false positives or false negatives, to ensure better-quality decision making going forward.
Empowered Teams. Ultimately, the innovation success of a company lives and dies with the quality of its innovation teams. Good teams are small (they adhere to Jeff Bezos’s two-pizza rule) yet functionally diverse, that is, they are staffed with a mix of product managers, engineers, and designers. They typically combine data-driven (patent scanning, for example) and human-centric (such as ethnographic) methods to find solutions to problems that add value for customers.
These teams need a healthy degree of autonomy, embedded in a supportive governance framework. Ideally, they are led by a strong product owner whose top task is to maximize the desirability and viability of the innovation while keeping it technically feasible to deliver in an acceptable time and at an acceptable cost. Incentives matter. Less successful companies tend to manage teams on delivery against expected outputs, while leaders reward high-quality outcomes. A high-quality outcome could be a resounding in-market success but also the early demise of an initially promising but ultimately doomed idea.
We recently assisted a large automotive company in improving the elements of its innovation system. Early idea generation at the company now starts by pairing deep technology and regulatory foresight with customer centricity. In cross-functional ideation sessions focused on anticipated future market opportunities, teams iteratively refine their ideas by drawing up a mockup product-launch press release. These teams address technical, market, and business risks by running an open backlog of implicit, to-be-validated beliefs. Through such methodical testing, the biggest innovation risks are addressed first, greatly improving the odds of an ultimate in-market success. Senior managers set an inspiring yet achievable ambition. They make decisions on the portfolio and funnel of projects every two months, ensuring thoughtful and timely decisions well informed by their proximity to the action.
Being a great innovator is not just about embracing best practices such as the ones detailed above, although doing that is table stakes. It’s also about spotting changes in the technology or regulatory environment, in markets, and in social norms, and then understanding which doors these changes open and which they shut. In many ways, the most successful companies see innovation as a learning journey in which the destination shifts in response to changing travel conditions. As it turns out, the real innovation challenge for large companies isn’t achieving one great success—When It Comes to Innovation, Once Is Not Enough.
3) They Calibrate Their Innovation Systems for Success
When It Comes to Innovation, Once Is Not Enough

Remember the Macarena? The song shot to the top of 15 global music charts in 1996 and was certified platinum in seven countries. It was also a one-hit wonder. The band that created it, Los del Rio, did just fine—but they never topped the charts again.
Startups have it relatively easy. They’re only expected to get it right once. If they do, and are acquired by a larger company, it’s a big victory. Larger companies are held to a higher standard. Their valuations depend on the market’s belief that they will be able to innovate successfully into the future. If they don’t, they’re punished by the market.
As we mentioned earlier, of the 162 companies that have made BCG’s annual ranking of the 50 most innovative companies since 2005, only eight made the list every year—and only 12% ranked in the top 50 ten or more times. (See Exhibit 1.) Serial innovation is hard. But in the current rapidly shifting customer and competitive environment, it is essential.

The 20 companies that made the list more than ten times come from a diverse set of industries—tech of course but also retail, automotive, industrial goods, and consumer products. (For a look at the 50 companies on the list in 2020 and the evolution of the top 50 over the past 14 years, explore this interactive exhibit.) Elon Musk of Tesla (which has made the list seven times) famously argued that even more important than the product is “the machine that makes the machine.” He has a point. Serial innovators succeed not because of the qualities of any individual offering. Rather, they draw on the strength of their underlying innovation systems, which integrate strategy, ecosystems, portfolio management, governance, development, performance management, and more into one seamless and mutually supportive whole. So what does it take to get it right again and again?
SYSTEMATIZING INNOVATION SUCCESS
Successful innovation pays. An investment of $100 made in the MSCI World Index in 2005 would have been worth $251 at the end of 2019. The same $100 invested in BCG’s 50 most innovative companies (assuming annual reweighting) would have grown to $327—30% more. Over the 15 years that we have produced this report, the top innovators have outperformed the companies in the MSCI index by more than 1 percentage point a year on sales growth and by 2 percentage points annually on total shareholder return (TSR).
Everyone knows the parable of the blind men and the elephant: each man can feel and describe a part of the animal, but none of them can get a sense of the whole. Elephants are big; innovation systems are complicated and multifaceted. They involve people and teams from multiple functions. They can have lots of moving organizational parts: R&D, ecosystem partners, incubators, accelerators, and corporate venture funds, for example. They include decision-making systems, processes to guide activities, as well as many less tangible factors such as embedded tools, capabilities, and cultural norms of behavior. In recent years, we have examined specific aspects of such systems: how successful innovators source ideas, how they collaborate, how they organize to support innovation, and how they incorporate new technologies into their programs.
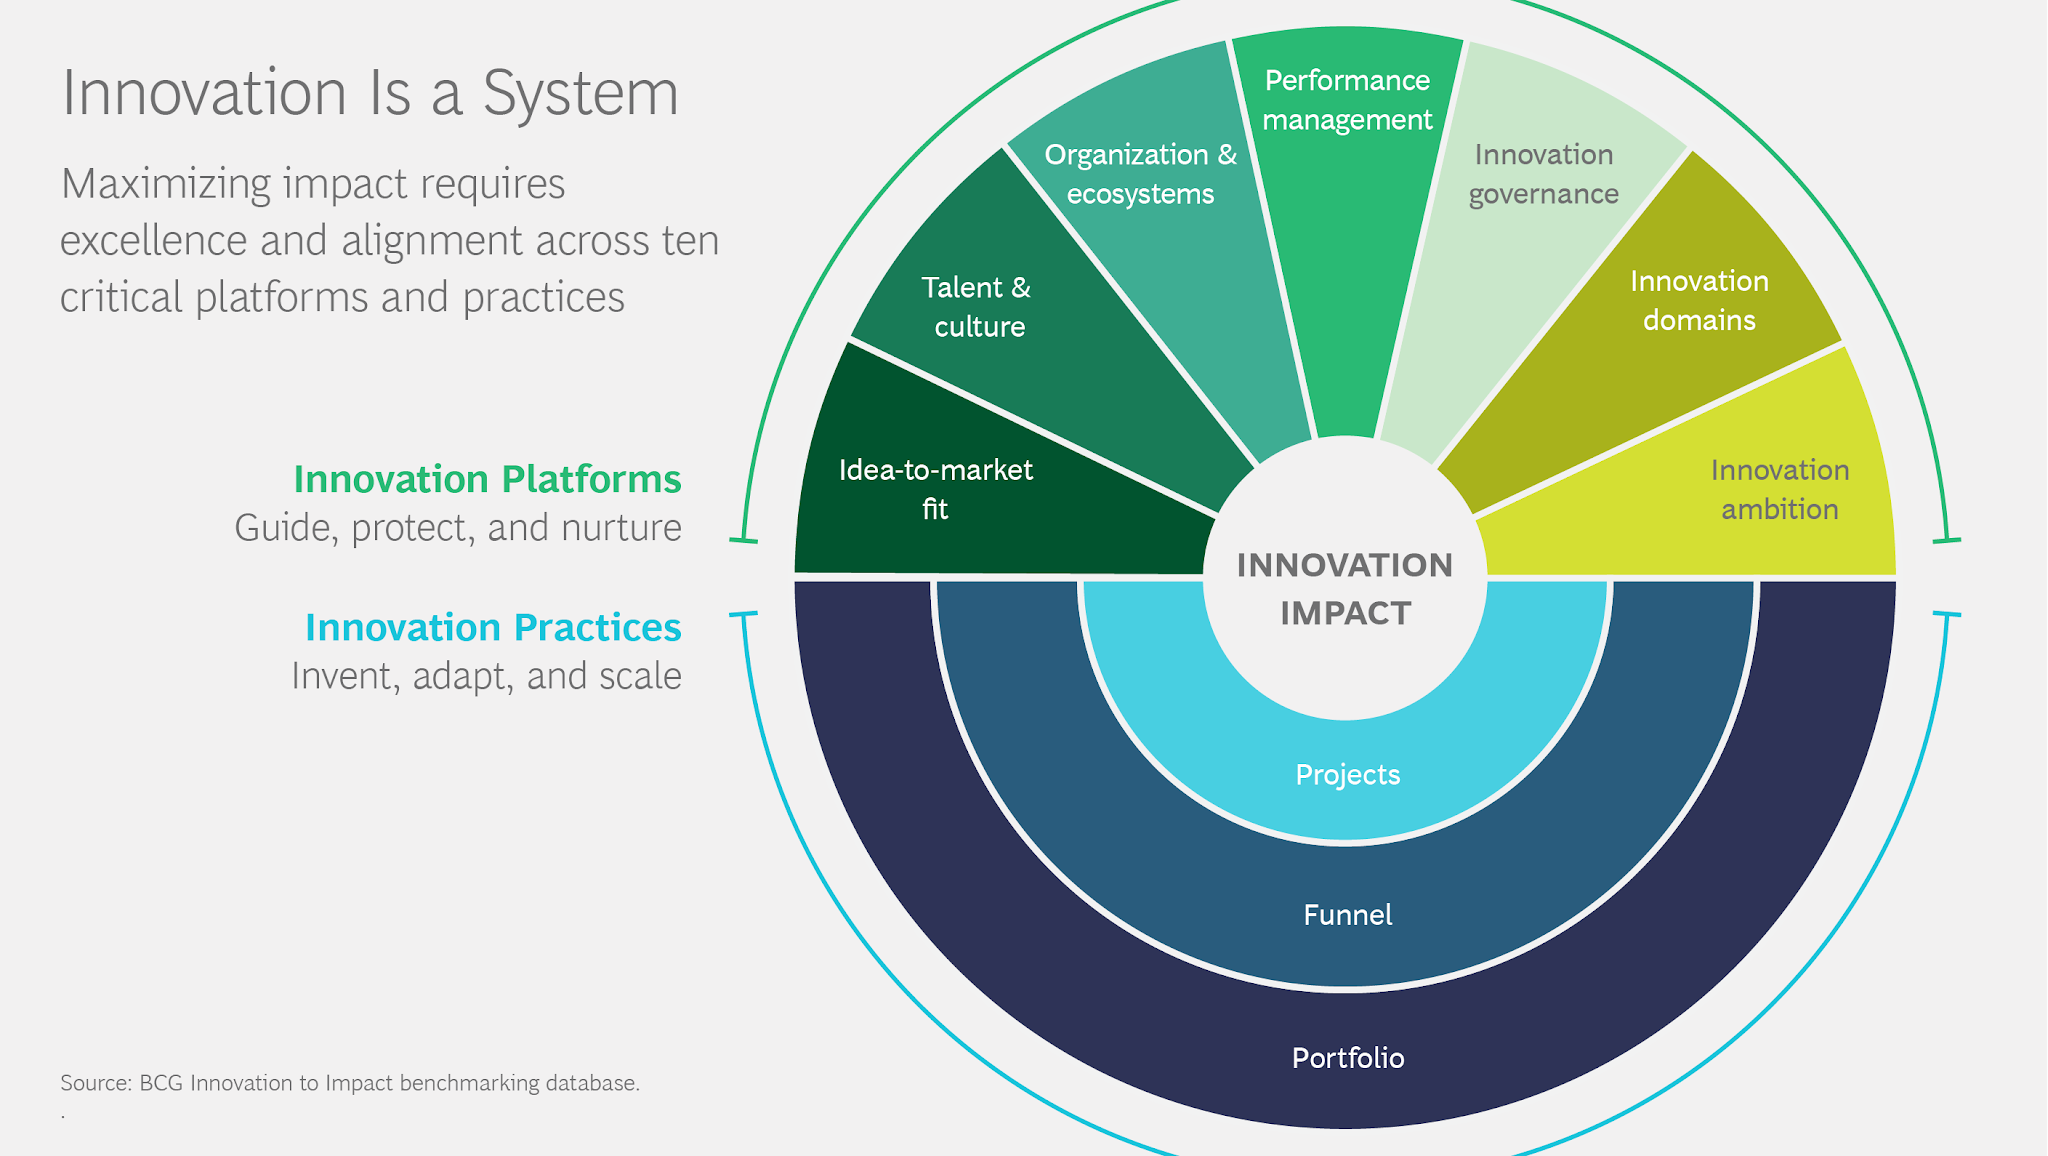
Companies with strong innovation systems do all these things well. But that’s often not enough. Innovation systems are dynamic. They need to be designed and regularly reworked to deliver the desired level of organic profitable growth—but they always need to be seen as a whole. On the basis of our research and experience, we assess innovation systems on ten elements. Seven relate to the innovation platforms and organization that set ambition, define innovation domains, delimit roles, shape portfolios, and measure and reward performance. And three are associated with the actual practice of moving a portfolio of projects to impact. (See Exhibit 2.)

The data from BCG’s innovation benchmarking database shows that companies with better systems achieve an increase of 5 to 20 percentage points in their innovation output (the percentage of sales from products, services, or business models introduced in the past three years).
In our experience, the most successful large innovators take a page from the instruction manual of serial acquirers and systematize the success factors. Serial acquirers integrate the discipline of effective M&A (from target identification and analysis to price setting and negotiation to rigorous post-merger integration) into their management systems. Serial innovators also understand that success depends on all facets of innovation working together toward a common goal of generating a continuing series of new products or services that make an impact where it counts—in the marketplace.
GETTING STARTED
It’s difficult for leaders, even those with 20-20 vision into their organizations, to get their arms around the entire machine and identify what’s working and what isn’t. In most large organizations, the CEO is the only leader who is in a position of authority to drive an innovation system. All other leaders are left with partial or functional mandates. For them to drive change, they need to build exceptional stakeholder orchestration skills in order to cut through silos and build coalitions across the organization.
An effective innovation journey starts with doing the careful work of establishing a common language on innovation, building a fact base for framing the challenge, and getting CEO buy-in. Only then can leaders decide which issues to attack first. What is working well? What are their companies’ most pressing weaknesses? What should they scrutinize first—strategy, governance, process, talent, incentives, culture, or something else?
We have found that a series of pointed questions, each of which focuses on one of the ten essential elements of the company’s innovation system, provide a good way to start. We derived these questions from BCG’s experience working in innovation and validated them against our benchmarking database containing data on the innovation performance and organization of more than 1,000 firms. The questions for innovators in a post-COVID-19 world reflect the typical gaps we see between leading innovators (benchmark companies) and those aiming to join their ranks:
- Innovation Ambition. Do we have a shared innovation purpose? Have we established an aspirational goal aligned with corporate strategy and value creation targets that rallies our best talent to invent better ways to serve customers and society?
- Innovation Domains. Is our innovation strategy grounded in deep customer insight and foresight that help us decide what to do—and not do—and enable us to nimbly adjust to shifting opportunities? Do we focus on a limited number of innovation domains where we have a right to win?
- Innovation Governance. Do we ensure that people and budgets are aligned with our shared innovation priorities—and promptly realigned when priorities shift—even when multiple stakeholders have a voice?
- Performance Management. Do our metrics and incentives reward both predictable, incremental progress and successful step-change innovation? Do we recognize leaders who are not only able to push new ideas but also recognize failures early in the process?
- Organization and Ecosystems. Do we have clear roles for all the disparate elements of our broader innovation ecosystem—for example, R&D units, venturing vehicles, digital units, and external partners—to ensure that we collaborate seamlessly and realize our targets?
- Talent and Culture. Do we have true business builders, and do we allocate our very best talent to our most ambitious innovation challenges?
- Idea-to-Market Fit. What’s the last truly novel idea we developed that solved a “hair on fire” problem for customers?
- Project Management. Do we have a clear view of our unfair advantage relative to our competition, and do we actually manage to wield it?
- Funnel Management. Is our funnel of potentially valuable projects actually funnel-shaped or is it a cylinder? Do we learn from past mistakes?
- Portfolio Management. Do we manage our portfolio strategically, for example, to ensure balance between core and noncore, or among new products, services, and business models? Do we take nonconsensus bets that promise outsize rewards? Have we reassessed and rebalanced our priorities and our portfolio through the COVID-19 lens?
Consider the well-known history of Apple. Ranked #1 in our top 50 list for all but one year since 2005, Apple is a poster child of successful innovation. But in the late 1990s the company was in trouble, losing out to the Wintel platform. After Steve Jobs’s return in 1997, he set about recalibrating the company’s innovation system for success. He broadened the ecosystem by engaging Microsoft as a partner, strengthened governance by focusing development on the projects most likely to drive value such as the iMac, and increased ambition by defining new domains for innovation (iPod in 2001, iTunes Music Store in 2003). These moves generated the resources and attracted the talent that fueled Apple’s serial innovation machine, which now—against the odds—outlives its original founder.
An effective innovation system takes time and experience to build. Practice, as well as learning from both successes and failures, is essential. Our list of ten questions does not replace the need for a more systematic assessment. From time to time, a company needs to reassess and revalidate all the elements of its innovation system—the “machine that makes the machine”—to ensure that it is delivering maximum value. Still, in our experience, these questions provide a starting point for innovation leaders to build a case for change, rally other stakeholders, and point to a first set of points for action. Successful serial innovators are made, not born.

THE 50 MOST INNOVATIVE COMPANIES
FOR 2020
The
50 Most Innovative Companies of 2020

Source: BCG Global Innovation Survey.
Note: Returnees have appeared on the ranking before but not in the prior year. Values in parentheses show change in ranking from 2019.
https://www.bcg.com/

