The intelligence era has arrived.
Explore the latest data from 1,700+ marketers on where AI is helping them outmarket their competitors.
·
Foreword
AI in the loop will help marketers outlearn,
outmarket, and outgrow their competitors
As a marketing leader, the most valuable asset your
business has today is your raw marketing intelligence. That marketing
intelligence lives inside the minds of your employees, in the experiments you
run, the data you get back, and the insights you get from customers.
If you’re not thinking ahead, that intelligence will leave
with your best employees or, worse still, be outsourced to AI models.

As part of HubSpot's annual "State of AI" studies, we surveyed over 1,700 marketers from individual contributors to CMOs to understand how, why, when, and where they’re using AI in the marketing process. Our recent data shows that there are still massive gaps between those adopting AI at a transformational level, and those still experimenting. And many still don’t even have their data meaningfully connected to their AI tools.
In this report, we’ll break down the data. But we’ll also
teach you how you can take action. Plus, you’ll find a customizable plan you
can tailor to your brand. We’re here on the journey, too, and sharing results
from our experiments as things evolve by the minute.
·
Introduction
Most teams are in the AI game, but few are winning it
To
get started, we asked marketing respondents using AI to rate their company and
department's level of AI adoption on a scale from "Early" to
"Transformational."
Here’s how we defined each of these stages:
Early
AI use is still taking shape at our company. It is mostly
experimental, limited to a small number of tasks or use cases, and outcomes are
not yet consistent.
Emerging
AI is being used in real workflows at our company and is delivering
value, but usage, processes, and outcomes are still evolving.
Established
AI is used reliably in repeatable workflows where it delivers
consistent value. Teams know where it fits, how it should be used, and what
outcomes to expect.
Transformational
AI is a foundational part of how the company operates and is
materially reshaping workflows, decisions, and business outcomes.
In some summaries below, "advanced" AI usage or adoption refers to respondents who mapped their team's AI maturity level as "established" or "transformational."
Most marketing teams are using AI in some way, whether in
the emerging, established, or transformational stage of adoption. However, only
10% of the marketers whose teams do use it say they are at the transformational
level. There’s room to grow, and many marketing teams are widening their
perspective on what AI can do for them.
Though 10% seems small, marketing is the #1 GTM function
for advanced AI adoption — with maturity stages far ahead of service and sales
professionals. When comparing marketing results to that of 4,000 global sales
and service professionals surveyed concurrently, 42% of marketers reported
advanced AI use (transformational and established) compared to 23% of service,
and 27% of sales professionals.
Marketing is the #1 GTM team for advanced AI adoption.
Marketing teams are also more likely than sales or service
teams to say AI is making revenue targets easier to hit. In fact, marketing
leads every major AI metric, including: highest advanced AI use, highest active
agent use, highest time savings, highest budget growth, strongest reported AI
impact on company revenue.

· Key Findings
How is AI actually changing marketing right now?
1. There’s still room to grow AI acumen
98% of marketing teams are using AI in some way, but only 10% have reached a transformational level.
2. AI helps with speed to market
Speed and agility is the #1 area where AI has improved performance.
3. Teams are employing AI agents
86% of marketing departments now use AI agents, and 76% of those say agent usage increased in the past 6 months.
4. Marketers feel threatened by AI, but it’s linked with career growth
53% of marketers are concerned AI could automate their role. But 1 in 5 transformational adopters credit AI for career trajectory gains.
5. AI skills are expected, but not required
35% of marketers say informal AI expectations already factor into hiring, performance reviews, and compensation.
6. Companies are increasing bets on marketing AI
67% of marketers say their departments have increased AI investments in the past 6-12 months.
AI is working, but are you working it?
AI is helping marketing teams hit their goals, but where it supports most depends heavily on role and level of organization-wide AI adoption. Smaller companies lean on AI for individual output, but enterprise teams use it for communication and strategic impact. Early adopters are able to move faster, but advanced adopters are able to move up in their careers.
Now that AI has moved past the experimental stage, the biggest barriers holding marketing teams back from advancement are related to trust, security, and compliance concerns. This holds steady from 2025, when data privacy concerns were the biggest barrier to adopting new AI tools.
What can AI do for you?
27%
of marketers report speed and agility as AI's #1 performance gain
22%
who are transformational adopters credit AI for career trajectory gains — vs. 5% at early stage
For transformational AI adopters, team communication depth is almost 2x higher than all respondents. Individual contributors see gains in speed, volume, and productivity, while directors report improvements in strategic areas like business impact and team motivation.

“In just a few months, I went from
barely using AI to building a personal brand strategy that drove over 3 million
impressions on LinkedIn, landing paid partnerships, and consulting with other
founders. And, I did it with the help of ChatGPT. What started as a tool to
help me brainstorm quickly became a career accelerator. It changed how I work,
how I show up, and how I earn.”
Valerie Chapman, Co-founder and
CMO of INFRM
AI maturity and goal attainment move together
The further along a company is in its AI journey, the more likely it is to be hitting its marketing targets, and by a much wider margin. 96% of transformational adopters are at or above marketing qualified lead (MQL) targets, compared to 74% at the early stage. Nearly half of transformational adopters (44%) say AI made customer acquisition cost (CAC) goals much easier to hit, versus just 12% at early stage.
There’s a pattern here, but companies further along in their AI maturity may simply have more budget, headcount, and room to experiment — the kind of resources that make it easier to hit targets with or without AI.


·
Strategy


https://tinyurl.com/422xfm4a
Those are some of the email marketing statistics uncovered by Delphin Digital when they reviewed research from third-party sources.
An infographic (below) covers key insights from the research.
It explores email marketing stats that marketers need to know in 2026 around seven areas: the global email landscape; subject lines and send times; engagement and ROI; automation, AI, and personalization; B2B marketing; B2C marketing; and the future outlook.
Check out the infographic:

https://tinyurl.com/9p6w7657
Did you know that nearly half of LinkedIn users are 25-34 years old?
Or that 53% of B2B marketers use LinkedIn to identify prospects?
Those are a couple of the key insights covered in an infographic (below) from Sopro.
It looks at 10 stats related to lead generation on LinkedIn that B2B marketers should know.
Check out the infographic:

https://tinyurl.com/bdhzpxdb

Social networks have transformed marketing and, as this post shows, their popularity is still growing in our latest global social media statistics research summary for 2024.
Networks vary in popularity with different demographics and they're still evolving. Research by Global WebIndex that we reference in this article shows that globally,
62.3% of the world's population uses social media. The average daily usage is 2 hours and 23 minutes (April 2024).
We'll keep this post updated during 2024 as the latest statistics are published drawing on our recommended top 10 digital marketing statistics sources. We'll be pointing to new data on the popularity of social media from Global Web Index (worldwide), Pew Internet Surveys (US) and OfCom (UK), and, most recently, the Datareportal January 2024 global overview, with the January review expected in the next few weeks.
This post will apply the latest reports to our answers in 7 key areas crucial to understanding consumer use of social networks:
Now more than ever, marketers need to make smart decisions when planning their digital distribution channels. So reviewing the latest social media diffusion and usage stats is a crucial part of any company's digital marketing strategy.
Datareportal regularly updates its global compendium of social media statistics, which we recommend as it gives some great insights into the world of social media. It's a great download for including slides for your presentations. Note that their data is compiled from other sources of which the Global Web Index panel is the best source, although only available to paid subscribers. If you're researching social network adoption, it's worth checking out GWI's top 10 2023 social media statistics and their free annual report of social media trends.
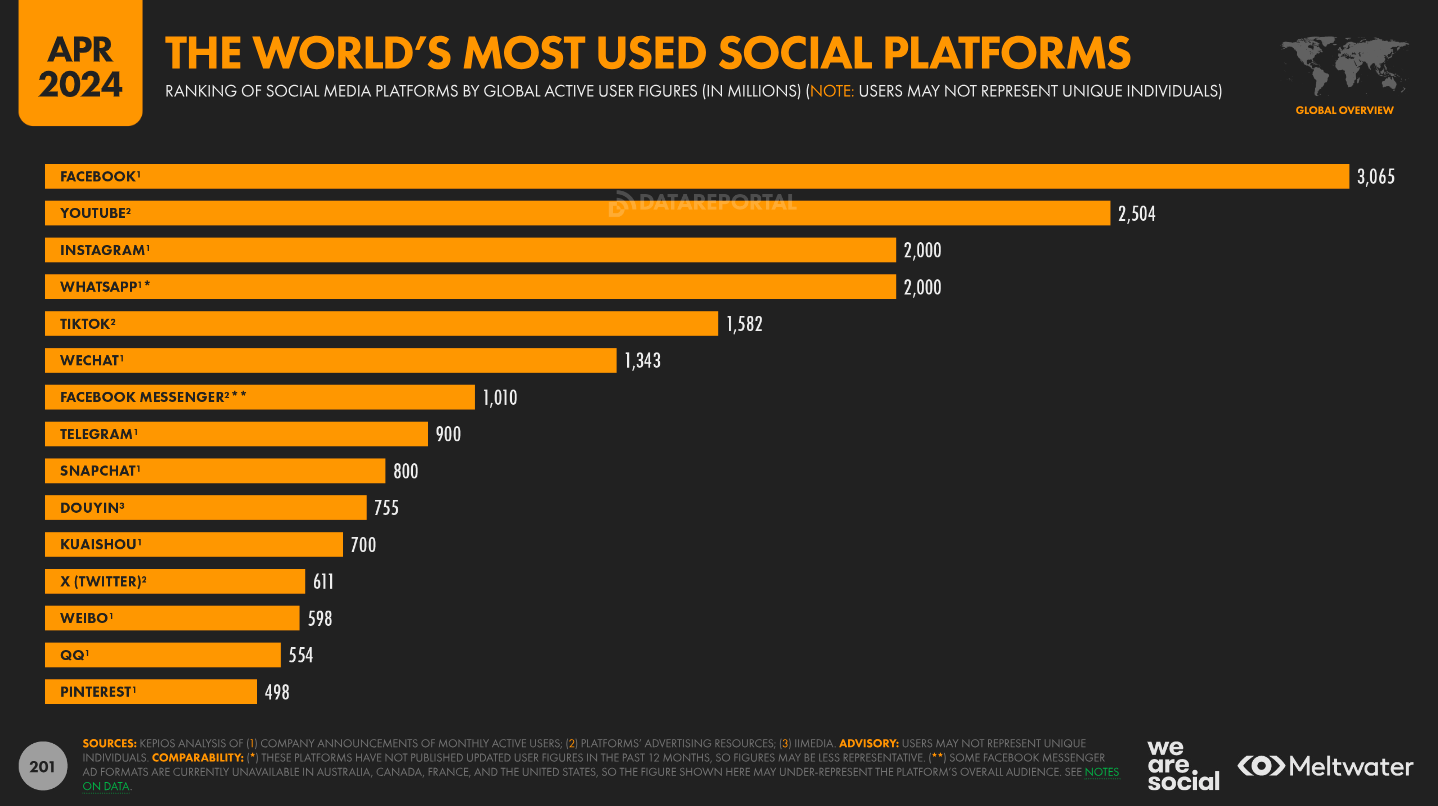
According to the Datareportal January April global overview, we can see that social media growth has continued to increase:
The full report from Datareportal contains insights collated from different data providers across 200+ slides. It provides country-specific data for the vast majority of the world, so you might want to check out the slides of the countries in your core markets to get a better idea of the current state of social in the areas you operate. In this post, we focus on the social media data which starts at slide 205 in the report.
This chart, by Datareportal, summarises the importance and growth of social media today.
Although the average daily time spent on social has slightly decreased (4 minutes), the growth of adoption remains high. Currently, 93.3% of internet users are using social media, and the gender split is fairly balanced, with slightly more male identities than female identities.

The best source for getting stats on the biggest social media platforms is direct from company statements and earning announcements.
Notably, of the top 4 social media platforms, 3 are owned by Meta. Facebook is the most-used platform in total - but as marketers, we know it's crucial to consider different trends of usage for different demographics, as we'll see below.

So, what does this mean for your social media marketing strategy?
Clearly, there are lots of opportunities to reach, interact with, convert, and engage social media users. Savvy marketers use social media across their marketing funnel, to influence journeys from product discovery, through to first purchases, loyalty, and advocacy.
Our RACE Framework has a data-driven structure that marketers can use to plan their own strategies.
This recent data from Comscore focused on the UK for Gen Z, Milennial and Gen X groups shows the wide variation in usage of social apps in the UK. In the younger age group Reddit and Discord are surprisingly important, in part because of Gaming. Facebook remains dominant in older age groups.

United States Social network popularity
The Pew Research Center news usage research is a very strong recent source showing US social media statistics trends in usage for news. Interestingly, nearly half of those surveyed used social media to get news often or sometimes.


Every marketer has limited time for social media marketing, so which fastest-growing social network should you focus your efforts on?
HubSpot has a good summary of these based on its own consumer survey - see Fastest growing US social platforms 2023 which features less well known, but growing social networks such as BeReal and Twitch.

The number of social media users globally grew from 4.72 billion in January 2023 to 5.04 billion in January 2024. This accounts for a 8% growth of +320 million users YOY. With more growth predicted over the rest of the year...
94.2% of internet users have social media identities today.
Social media platforms today are evolving and developing to meet an ever-wider variety of consumer wants and needs. Surely the value that social media usage can add to consumers' lives is more evident than ever before - social media marketers can tap into that.
2024 analysis of regional use of social media shows the wide variation of social media penetration:


One of the challenges of social media marketing is that by its nature, social media are peer-to-peer, involving conversations between friends, families and colleagues. Given this, brands must be sensitive to how they use social media.
Insight from GWI shows the important role that social media plays in influencing brand discovery and in encouraging purchase. This insight shows the relative importance of ads, recommendations and updates to business social media pages in brand discovery.


Our new Organic Social Media Learning Path modules are dedicated to helping marketers optimize their organic Instagram marketing with a strategic approach, integrated across the marketing funnel.
Our bite-sized modules contain tools and templates designed to help you address the systematic issue of businesses using social media platforms to create standalone posts rather than planning a strategy.
Our Social Media Learning Path has modules with dedicated help for:

Social media statistics benchmarking tool Rival IQ produces these useful sector-by-sector benchmarks of social media engagement metrics including:
These include useful sector benchmarks for Facebook, Instagram, and Twitter you can compare against. Here is a sample of the insights from their 2022 report.
Facebook engagement rates
The 2021 median average engagement rate per post (by follower) on Facebook is 0.064%, across all industries. Sports Teams see the highest engagement, achieving an average of 0.27%, followed by Influencers with 0.23% and Higher Education with 0.15%.
At the lower end of the spectrum, Health & Beauty, and Tech & Software receive an average 0.02% engagement rate.

Instagram engagement rates
Engagement rates are significantly higher on Instagram compared to Facebook. As you can see the 2021 average median engagement rate per post (by follower) is more than 10x higher, despite engagement on Instagram dropping approx 30% between 2020-21.

Marketers know intuitively that the right type of visuals and videos are more effective in gaining engagement.
This is supported by observed interaction rates. According to LinkedIn, Images typically result in a 2x higher comment rate and Video gets 5x more engagement on LinkedIn, Live Video gets 24x more.
This is also supported by this data from this Social Bakers social media trends report:

Videos longer than a minute achieved the highest median interactions and median reach on Facebook, according to Socialbakers data.
In fact, for both reach and interactions, there was a correlation that showed the longer a video was, the further it reached and the more interactions it received.
Socialbakers’ metrics for video length are very short (less than 11.882 seconds), short (more than 11.882 and less than 24.362 seconds), medium (more than 24.362 and less than 61.248 seconds), long (more than 61.248 seconds and less than five minutes), and very long (more than five minutes).

As you can see, different platforms offer different opportunities for capturing different audiences. The trick is finding the right techniques to that to your channel goals.
If you're looking for one simple reference guide which contains all the social media channel updates in an easy-to-track format, look no further than our digital media updates tracker, which is updated quarterly, to make sure our Business Members never miss a trick.
Testing different frequencies of updates and timing is another aspect of social media optimization based on consumer behaviour.
Each network tends to have a ‘sweet spot’ for frequency based on its algorithms. It used to be beneficial to post several times a day on Facebook for many brands, but with decreased organic reach, a single update tends to be more effective. We find a higher frequency on LinkedIn or Twitter tends to be more effective.
Sprout Social's 2022 social media strategy builder compares the best times to post on social media. Compare these to your patterns of posting and consider how you could post differently.
Each network tends to have a ‘sweet spot’ for frequency based on their algorithm and the most common times for consumer usage. It used to be beneficial to post several times a day on Facebook for many brands, but with decreased organic reach, a single update tends to be more effective.
We find a higher frequency on LinkedIn or Twitter tends to be more effective. The results from Instagram and Facebook show a clear preference for around midweek at midday, so you should consider this when scheduling your post updates.

https://tinyurl.com/mpm4jsh4