
Businesses have a lot of unstructured data. According to statistics, almost 80% of companies’ data is unstructured. Also, the growth rate of unstructured data is 55-65% per year. Since this data cannot be arranged into a tabular form, it is difficult for enterprises, especially small businesses, to use unstructured data. This is why business analytics tools are becoming widely popular. Cluster analysis is a business analytics tool that helps companies sort unstructured data and use it for their maximum advantage.
What is Cluster Analysis?
Cluster means arranging or grouping similar items. Therefore, as the name suggests, cluster analysis is a statistical tool that classifies identical objects in different groups. Objects within a cluster have similar properties, whereas objects of two separate clusters are entirely different. Cluster analysis serves as a data mining or exploratory data tool in business analytics. It is used to identify similar patterns or trends and compare one set of data with another.
The cluster analysis tool is mainly used to segregate customers into different categories, figure out the target audience and potential leads, and understand customer traits. We can also understand cluster analysis as an automated segmentation technique that divides data into different groups based on their characteristics. It comes under the broad category of big data.
What are the Different Types of Clustering Models?
There are broadly two types of clustering: hard and soft clustering. In hard clustering, each data point is definite and included only in one cluster. On the other hand, data points in soft clustering are arranged based on probability. We can fit one data point in different clusters in soft clustering. The following are the most popular types of clustering models in business analytics:
- Hierarchical:- The hierarchical clustering algorithm arranges the clusters in a hierarchy. It creates a tree of clusters. Then, the two closest clusters are arranged into one pair. This new pair is further combined with another pair.
For example, if there are eight clusters, the two clusters with maximum similar characteristics will be arranged together and form one branch. Similarly, the other six clusters will be arranged into a pair of three clusters. The four pairs of clusters will be brought together to form two pairs of clusters. The remaining two clusters will also be merged to form a head cluster. The clusters appear in the shape of a pyramid.
Hierarchical clustering is further divided into two different categories – agglomerative and divisive clustering. Agglomerative clustering is also called AGNES (Agglomerative Nesting) in which two similar clusters are merged at every step till one combined cluster is left. On the other hand, divisive hierarchical clustering, also called DIANA (Divise Analysis), contradicts AGNES. This algorithm divides one cluster into two clusters.
- K – Means:- The K-means cluster analysis model used predefined clusters. Using the K – means clustering algorithm is to find local maxima in each iteration. This algorithm keeps on calculating the centroid until it finds the correct centroid.
- Centroid:- Centroid is also an iterative clustering algorithm. It finds similarities between two clusters by calculating the closest distance between the data point and the centroid. Then, the centroid clustering algorithm is used to find the local optima. The data points in this algorithm are predefined.
- Distribution:- This clustering algorithm is based on probability. It uses normal or Gaussian rules to find the probability between data points of one cluster. The data points are arranged in a cluster based on a hypothesis or a probability in the distribution model. However, this is an overfitting model. It means that we need to put some limitations while using the distribution algorithm.
- Density:- The density cluster algorithm searches the data space to arrange the data points with varying densities. This algorithm creates separate density regions based on different densities.
Benefits of Cluster Analysis
Here are the two most significant benefits of cluster analysis!
- Undirected Data Mining Technique:- Cluster analysis is an undirected or exploratory data mining technique. It means that one cannot form a hypothesis or predict the result of cluster analysis. Instead, it produces hidden patterns and structures from unstructured data. In simple terms, while performing cluster analysis, one does not have a target variable in mind. It produces unexpected results.
- Arranged Data for Other Algorithms:- Businesses use various analytics and machine learning tools. However, some analytics tools can only work if we provide structured data. We can use cluster analysis tools to arrange data into a meaningful form for analysis by machine learning software.
Cluster Analysis Applications
Businesses can use cluster analysis for the following purposes:
- Market Segmentation:- Cluster analysis helps businesses in market segmentation by creating groups of homogenous customers with the same behaviors. It is beneficial for businesses with a wide range of products and services and cater to a large audience. Cluster analysis helps businesses determine customer response to their products and services by arranging the customers with the same attributes in one cluster. This allows the businesses to organize their services and offer specific products to different groups.
- Understanding Consumer’s Behavior:- Cluster analysis is beneficial for companies to understand consumer behavior like their preferences, response to products or services, and purchasing patterns. This helps businesses to decide their marketing and sales strategies.
- Figuring Out New Market Opportunities:- Businesses can also use cluster analysis to understand news trends in the market by analyzing consumer behavior. It can help them expand their business and explore new products and services. Cluster analysis can also help businesses figure out the strengths and weaknesses and their competitors.
- Reduction of Data:- It is difficult for businesses to manage and store tons of data. Cluster analysis helps businesses segregate valuable information into different clusters, making it easier for companies to differentiate between valuable and redundant data that can be discarded.
How to perform Cluster Analysis?
Each cluster analysis model requires a different strategy. However, the following steps can be used for all cluster analysis techniques.
- Collect Unstructured Data:- You can perform cluster analysis on existing customer data. However, you will need to collect fresh information if you wish to understand recent trends or consumer traits. You can conduct a survey to learn about new market developments.
- Selecting the right variable:- We begin cluster analysis by choosing a variable or a property based on which we can segregate one data point from another. It helps narrow down the property based on which clusters will be formed.
- Data scaling:- The next step is to scale the data into different categories. It means categorizing data based on the selected variables.
- Distance Calculation:- The last step of cluster analysis is calculating the distance between variables. Since the data points are arranged into clusters with different factors, we need to prepare an equation considering all the variables. One of the most simple ways is to calculate the distance between the centers of two clusters.
Conclusion
Cluster analysis is a popular business analytics tool that helps convert unstructured data into usable formats. As companies are collecting increasing amounts of data every passing year, it becomes necessary for them to use data for meaningful purposes. Therefore, cluster analysis jobs are expected to grow by multiple folds in the coming years. According to statistics, the average salary of a cluster manager in the US is $79,109. On the other hand, the average salary of a data analyst in the US is $65,217.
If you are intrigued by data analytics and have sharp business acumen, you can join the Business Analytics Certification Program offered by upGrad.
мhttps://cutt.ly/74At7rb
A Step-By-Step Guide To Cluster Analysis In Predictive Analytics


Cluster analysis is subjective, and there are various ways to work with it. As more than 100 clustering algorithms are available, each method has its own rules for defining the similarities between the objects. Let us explore the most common ones in detail below:
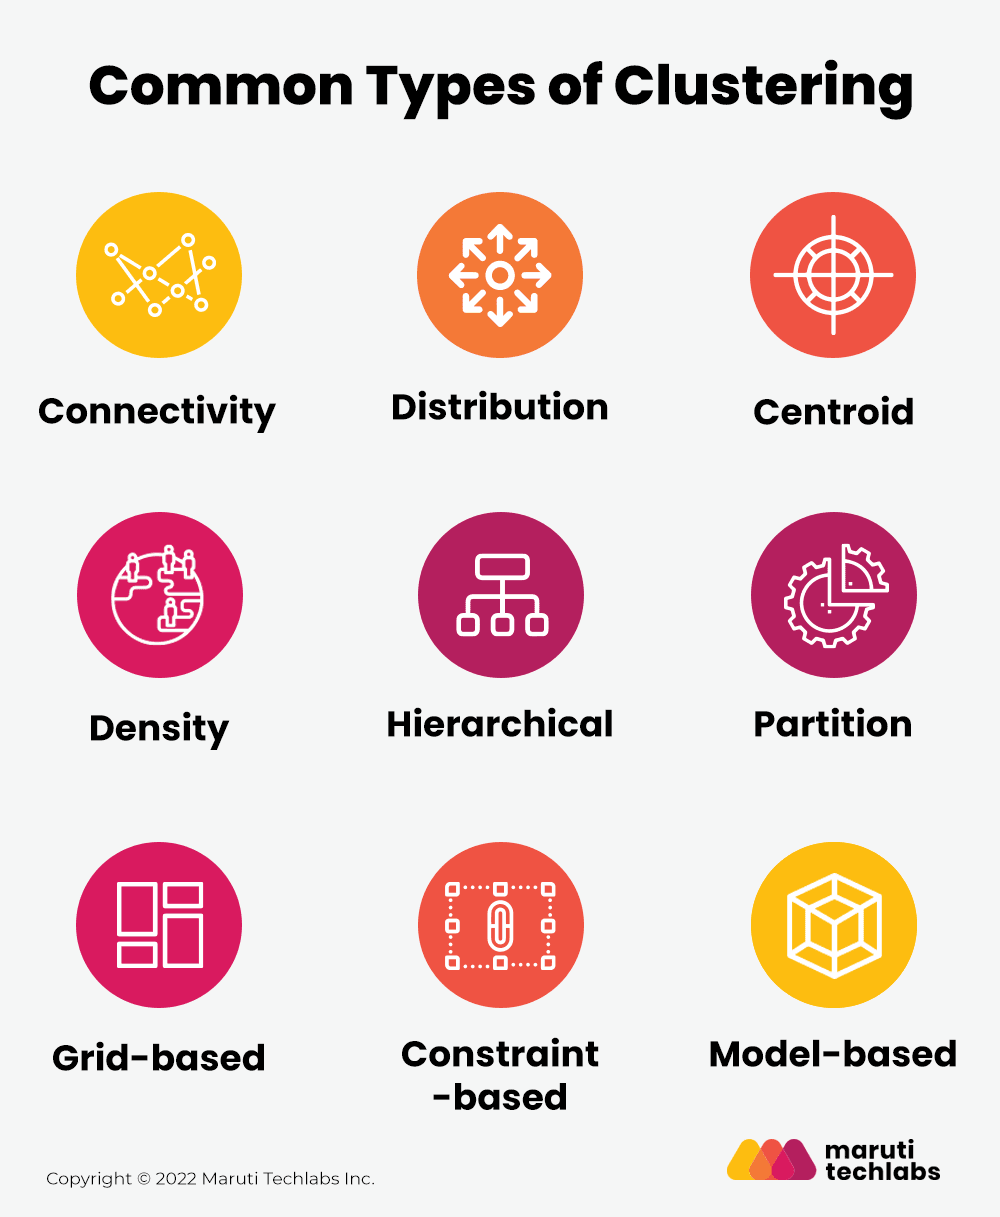
1. Connectivity Clustering
Connectivity models are where the data points closer in data space are more similar than data points farther away. You can further divide the connectivity model into partition-based and proximity-based models.
Proximity-based models use different functions for defining distance, though this is subjective. Partition-based models follow two approaches: the first approach involves classifying all data points into clusters and aggregating them as distance decreases. The second consists of all data points identified as a single cluster and partitioned as the distance increases. Proximity-based models are easier to interpret yet have a limited ability to scale for large datasets.
2. Distribution Clustering
In this type of cluster analysis, clusters are separated by the areas of density higher than the rest of the data set. Hence, the cluster is usually divided by the objects in sparse regions. Typically, the items in these light regions are noise and border points in the graph.
3. Centroid Clustering
It is an interactive clustering algorithm where the similarity is considered the proximity of the data point to the cluster’s centroid. K-Means cluster analysis is an example of a centroid clustering model, where k represents the cluster centers and elements are assigned to the nearest cluster centers.
When it comes to centroid models, the number of clusters necessary after the centroid model must be established, making previous knowledge of the dataset essential.
4. Density Clustering
This cluster analysis model is based on the density of the element. For instance, there is a lot of density when there are multiple elements adjacent to each other. Hence, those elements are considered to belong to a particular cluster.
Here, you can use a formula to determine the density of acceptable elements for a particular collection of information. If the computed density is less than the threshold, the collection in question has too few relevant elements to form a cluster.
5. Hierarchical Clustering
Hierarchical cluster analysis is a model that creates the hierarchy of clusters. Beginning with all the data points allocated to their respective cluster, the method combines the two closest clusters into the common one. At last, the algorithm will only stop when only one cluster is left.
Hierarchical clustering is further divided into two sections:
- Agglomerative Approach: Bottom-up approach combines the small clusters until all the groups merge into one cluster.
- Divisive Approach: Top-down approach where a cluster splits into smaller clusters in continuous iterations.
6. Partition Clustering
Assume you are given a database of “n” objects and the partitioning method constructs “k” partitions of data. Note that the partitioning approach may construct one or more partitions, with the number of partitions being fewer than or equal to the total number of objects in the dataset.
The following conditions must be satisfied by each data group:
- Each must contain at least one object.
- Each object must belong to just one group.
7. Grid-based Clustering
All the objects are combined in this cluster analysis to form a grid-like structure. The object space is then quantized into a finite number of cells to produce a grid structure. The most significant benefit of this clustering is the short processing time, as the cell density in each dimension of the quantized space does not affect this operation.
8. Model-based Clustering
This technique postulates a model for each cluster to discover the best data fit for that particular model. This approach locates the clusters and reflects the data points’ geographical dispersion by grouping the density function.
Model-based cluster analysis is one of the reliable clustering approaches. It allows you to automatically identify the number of clusters depending on the conventional statistics and accounting for outliers or noise.
9. Constraint-based Clustering
This cluster analysis technique executes the algorithm based on user or application-oriented constraints. A constraint is the user expectation or the attributes of the expected clustering results. Note that the user or the system must specify the constraints here.
Requirements For Cluster Analysis In Data Mining

1. Handle different attributes
As a single cluster analysis algorithm may be used against multiple data sets with various characteristics, it is advisable to have a flexible clustering algorithm that can deal with multiple attributes like binary data, numerical and categorical data, etc.
2. Handle noise data
Datasets sometimes may contain irrelevant, missing, or noisy data. Several algorithms are sensitive to such data and may produce low-quality results.
3. Identify the cluster with random shapes
Clusters of any form should be detectable by the cluster analysis technique. They should not be restricted to distance measurements that locate spherical clusters of tiny sizes.
4. Scalability
When dealing with large datasets, it is necessary to have a highly scalable cluster analysis algorithm.
5. High dimensionality
Some datasets are low dimensional, and some are high dimensional. The cluster analysis algorithm must be able to handle both kinds of dimensionalities.
6. Interpretability
The result of the clustering algorithm must be easy to interpret and understand. Also, it is not possible to have new clustering algorithms for every data analysis. Hence, it helps to have an algorithm that is reusable to a certain extent.
Business Applications Of Cluster Analysis
Every industry deals with tons of data. And where there is data, there is categorization. Clustering helps in the broad classification of data and hence has several business applications in today’s age. Let’s discuss some of them below:

Every industry deals with tons of data. And where there is data, there is categorization. Clustering helps in the broad classification of data and hence has several business applications in today’s age. Let’s discuss some of them below:
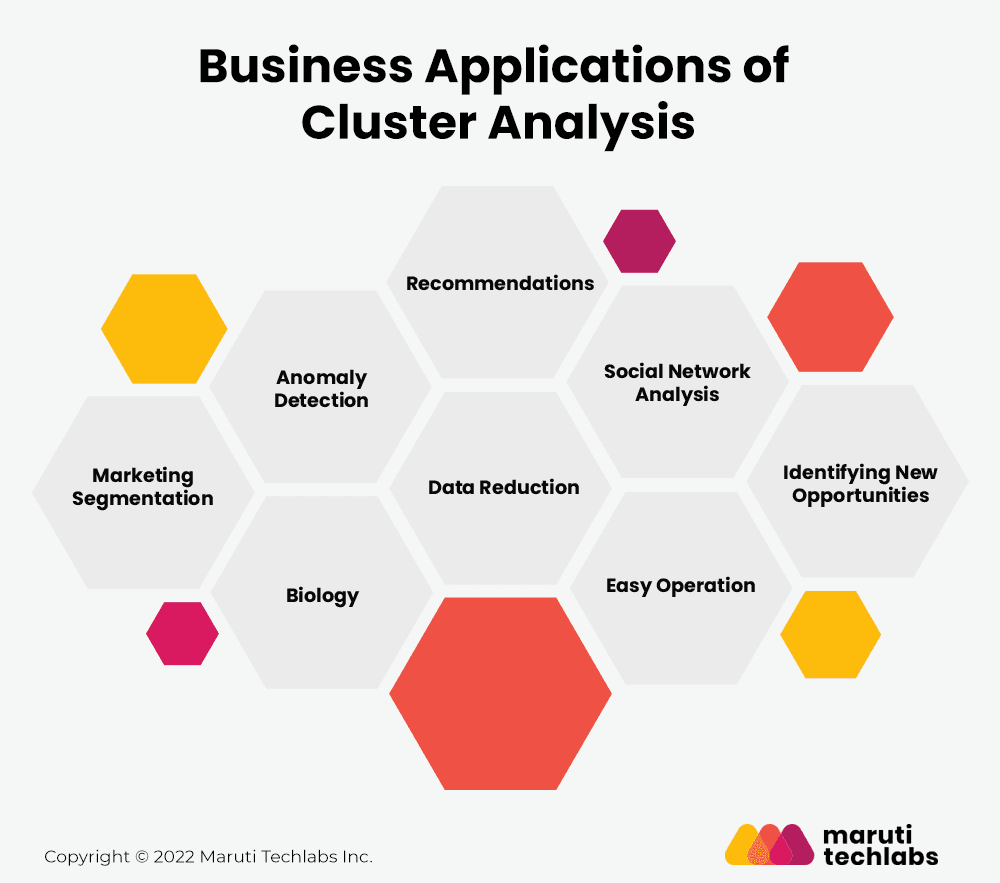
1. Marketing Segmentation
Cluster analysis techniques help marketers and companies divide their target audience into distinct segments with similar interests and features rather than having homogenous groups of consumers. Doing this helps businesses strategically target their products and services to those looking for the same.
2. Anomaly Detection
Cluster analysis in data mining is the best way to analyze anomalous activities, for instance, identifying fraud transactions. Cluster detection methods first examine the sample of good transactions and identify patterns, sizes, and shapes of regular activities. In case of a fraud transaction, the cluster will differentiate its pattern from a standard action and flag the activity.
3. Biology
You can use cluster analysis algorithms to develop plant and animal taxonomies, classify the genes with comparable functionality and obtain insight into population structures.
4. Identifying New Opportunities
Using cluster analysis for brands and products helps identify similar competitive markets with the same services or products. Further, it also aids in market research, pattern recognition, data analysis, and image processing functionality which can help improve business decisions. With these results, organizations can analyze their current growth relative to their competitors to identify the potential of new products.
5. Data Reduction
Data reduction is an undirected cluster analysis technique used to identify the hidden patterns within the vast data without formulating a specific hypothesis. To do the same, you may consider many clustering methods and choose the one which best suits your business requirements.
6. Recommendations
You may have got must-watch notifications from Netflix. Ever wondered how they know your taste in movies? The answer is cluster analysis. Cluster analysis enables recommendation engines to understand your preferences and provide you with something of your choice from the clusters of different genres.
7. Social Network Analysis
Social sites like Facebook and Instagram use clustering techniques to group people with similar interests and backgrounds. Doing this helps them show similar feeds to those of the same interest.
8. Easy Operation
Cluster analysis helps divide the extensive complex dataset into smaller parts and perform efficient operations. For example, you can improve the results for logistic regression by performing operations on smaller clusters that behave differently and follow different distributions.
Validation Of Cluster Analysis
Once you are provided with the results for your cluster analysis, it is time to validate your results. But the question is, how? Let’s try to find the answer using two ways of validation of cluster analysis:
1. Internal Validation
Use alternative predictive analytics methods to compare the outcome of cluster analysis quantitatively. Note that this does not guarantee that one or other method is the right one; it merely illustrates some potential options! This way, we can know which approach yields the best results and which you might want to consider using to organize your data further for more convenient analysis.
Internal validation further includes three measures of validation discussed below:
- Compactness: This measurement helps identify how close the elements are within the cluster. Note that the different indices for evaluating the cluster’s compactness depend on the average distance between the observations. As a result, the lower within-cluster variation indicates good compactness and vice versa.
- Separation: This parameter helps indicate how well the cluster is separated from other clusters. The indices used for separation measures include the distance between the cluster center and the pairwise distance between different elements inside the cluster.
- Connectivity: This parameter specifies how closely objects in the data space are clustered with their nearest neighbors. The connectivity ranges between 0 and infinity and should be kept as low as possible.
2. External Validation
To test the validation of your cluster analysis algorithm, you can apply it to another dataset whose outcome has been already determined. This approach can have disadvantages as well! The test set may have been put together in a way that suits one method better than the other.
Overall, it means that validation for clustering doesn’t show us exactly which methods are better or worse for specific data sets, but they still may be considered valuable. Absolute value cannot be attached to a validation method.
What Are The Limitations Of Cluster Analysis?
The biggest drawback of cluster analysis is that the term “clustering” is a broad-ranging term. It means that there are various methods to segregate data into groups. Consequently, different ways of clustering yield different results. This happens because different ways of grouping are based on different criteria.
Also, there are many cases where you are unaware of whether the chosen cluster analysis technique is relevant to the given problem or not. Therefore, another limitation of cluster analysis is that there are minimal ways by which you can validate the results you obtained.
How Maruti Techlabs Used Cluster Analysis To Make Better Predictions
Cluster analysis has been widely used for several years due to its ability to group similar records. It is beneficial for understanding how different categories of customers behave within different segments, allowing businesses to make better decisions about their products or services.
At Maruti Techlabs, we implemented a cluster analysis solution for one of our clients, providing marketing and lead generation services.
The Challenge:
Our client relied heavily on telemarketing or cold calling their prospects to generate leads. Making sales pitches on the phone to an answering machine was an unnecessary waste of the company’s time and money.
To overcome this challenge, our client was looking to build a predictive model to quickly identify whether the agent was speaking to a human or an answering machine.
The Solution:
To build the predictive model, we analyzed thousands of audio clips and decided to categorize them into two broad categories – Human Answered (HA) and Answering Machine (AM).
With the help of cluster analysis and predictive analysis model, we categorized the audio clips into the two categories. However, in the live scenario, we saw that 73% AM and 27% HA fell in the same cluster. It showed that the audio characteristics were not correctly labeled.
The data scientists at Maruti Techlabs developed a Python-based predictive model to segregate the audio clips into HA or non-HA more accurately. The predictive model successfully predicts the audio characteristic within the first 500 milliseconds of the audio input.
The model enhanced backend operations by integrating with the client’s existing tech stack, increasing efficiency, and strengthening the existing systems. As a result, the predictive model now saved 30 minutes per agent and reduced $110,000 per month in operating costs.
https://cutt.ly/d4AuKtl
What Is The KMeans Clustering Algorithm And How Does An Enterprise Use It To Analyze Data?


What is the KMeans Clustering algorithm?
The KMeans Clustering algorithm is a process by which objects are classified into number of groups so that they are as much dissimilar as possible from one group to another, and as much similar as possible within each group. KMeans Clustering is a grouping of similar things or data. For example, objects within group 1 (cluster 1) shown in image below should be as similar as possible.c

But there should be much difference between an object in group 1 and group 2.
The attributes of objects decide which objects should be grouped together. This method is used to find groups that have not been explicitly labeled in the data, and it can be used to confirm business assumptions about what types of groups exist, or to identify unknown groups in complex data sets. Once the algorithm has been run and the groups are defined, any new data can be easily assigned to the correct group.
How Does an Enterprise Use the KMeans Clustering Algorithm to Analyze Data?
In order to understand how best to make use of this algorithm; let’s look at some general examples, followed by some business use cases.
- Loan applicants in a bank might be grouped as low, medium, and high risk applicants based on applicant age, annual income, employment tenure, loan amount, the number of times a payment is delinquent etc.
- A movie ticket booking website can group users into frequent ticket buyers, moderate ticket buyers and occasional ticket buyers, based on past movie ticket purchases.
KMeans Clustering can be applied to segment customers by purchasing history, segment users by the activities they perform on a website, define demographic profiles based on interests, and recognize market patterns.
Use Case – 1
Business Problem: Organizing customers into groups/segments based on similar traits, product preferences and expectations. Segments are constructed on basis of the customers’ demographic characteristics, psychographics, past behavior and product use behaviors.
Business Benefit: Once the segments are identified, marketing messages and even products can be customized for each segment. The better the segment(s) chosen for targeting by a particular organization, the more successful it is assumed to be in the market place.
Use Case – 2
Business Problem: Discount Analysis and Customer Retention will help the organization to target discounts to specific customers and the business will need to visualize ‘segments of sales group based on discount behavior’ and ‘customer churn to identify segments of customers on the verge of leaving’.
Business Benefit: The business marketing team can focus on risky customer segments in an efficient way in order to avoid losing those customers. Sales team segments that are facing challenges based on any current discounting strategy can be identified and a deal negotiation strategy can be improved and optimized.
The KMeans Clustering algorithm is very useful in identifying patterns within groups and understanding the common characteristics to support decisions regarding pricing, product features, risk within certain groups, etc.
https://cutt.ly/f4AE8dC
Clustering
A branch and bound cluster analysis tree is shown below.

In this example, the items to be clustered have been given 4 digit descriptors or names, the first digit being the most significant descriptor and the last digit the least significant, thus the two items "1111" and "1112" both fall into the category or cluster "111x", similarly, the two items "1121" and "1122" both fall into the category or cluster "112x"; and both these clusters fall within the larger cluster "11xx".
In creating such a cluster analysis tree, one should (conventionally) continue clustering until all items and categories fall into one "super" cluster - in this example "1xxx".
Various processes exist for clustering items, including statistical software of varying degrees of complexity and sophistication. However the purpose for which one is clustering items should always be borne in mind as this will have a profound effect on the final clusters that result.
https://cutt.ly/z4ARvRi
Комментариев нет:
Отправить комментарий