(continuation. Part 1 - https://cutt.ly/Y8gILDi )
Monopoly
Definition of Monopoly
- A pure monopoly is defined as a single seller of a product, i.e. 100% of market share.
- In the UK a firm is said to have monopoly power if it has more than 25% of the market share. For example, Tesco @30% market share or Google 90% of search engine traffic.
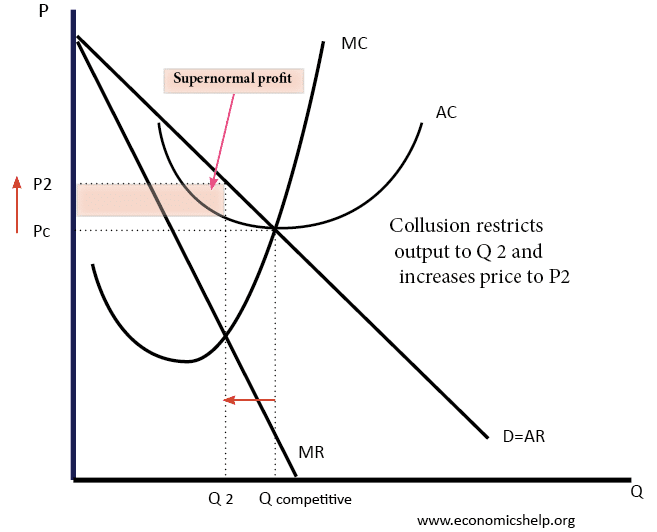
Monopoly Diagram

A monopolist will seek to maximise profits by setting output where MR = MC
This will be at output Qm and Price Pm.
Compared to a competitive market, the monopolist increases price and reduces output
Red area = Supernormal Profit (AR-AC) * Q
Blue area = Deadweight welfare loss (combined loss of producer and consumer surplus) compared to a competitive market
Problems of Monopoly
- Higher prices. Firms with monopoly power can set higher prices (Pm) than in a competitive market (Pc). (Red area is supernormal profit)
- Allocative inefficiency. A monopoly is allocatively inefficient because in monopoly (at Qm) the price is greater than MC. (P > MC). In a competitive market, the price would be lower and more consumers would benefit from buying the good. A monopoly results in dead-weight welfare loss indicated by the blue triangle. (this is net loss of producer and consumer surplus)
- Productive inefficiency A monopoly is productively inefficient because the output does not occur at the lowest point on the AC curve.
- X – Inefficiency. – It is argued that a monopoly has less incentive to cut costs because it doesn’t face competition from other firms.Therefore the AC curve is higher than it should be.
- Supernormal Profit. A monopolist makes Supernormal Profit Qm * (AR – AC ) leading to an unequal distribution of income in society.
- Higher prices to suppliers – A monopoly may use its market power (monopsony power) and pay lower prices to its suppliers. E.g. supermarkets have been criticised for paying low prices to farmers. This is because farmers have little alternative but to supply supermarkets who have dominant buying power.
- Diseconomies of scale – It is possible that if a monopoly gets too big it may experience dis-economies of scale. – higher average costs because it gets too big and difficult to coordinate.
- Lack of incentives. A monopoly faces a lack of competition, and therefore, it may have less incentive to work at product innovation and develop better products.
- Lack of choice. Consumers in a monopoly market face a lack of choice. In some markets – clothing, choice is as important as price
Advantages of monopoly

Advantages of Monopoly
- Research and development. Monopolies can make supernormal profit, which can be used to fund high-cost capital investment spending. Successful research can be used for improved products and lower costs in the long term. This is important for industries like telecommunications, aeroplane manufacture and pharmaceuticals. Without monopoly power that a patent gives, there may be less development of medical drugs. In developing drugs, there is a high risk of failure; monopoly profits give a firm greater confidence to take risks and fund research which may prove futile.
- Economies of scale Increased output will lead to a decrease in average costs of production. These can be passed on to consumers in the form of lower prices. See: Economies of Scale This is important for industries with high fixed costs, such as tap water and steel production.


- International competitiveness. A domestic firm may have monopoly power in the domestic country but face effective competition in global markets. E.g. British Steel has a domestic monopoly but faces competition globally. With markets increasingly globalised, it may be necessary for a firm to have a domestic monopoly in order to be competitive internationally
- Monopolies can be successful firms. A firm may become a monopoly through being efficient and dynamic. A monopoly is thus a sign of success, not inefficiency. For example – Google has gained monopoly power through being regarded as the best firm for search engines. Apple has a degree of monopoly power through successful innovation and being regarded as the best producer of digital goods.
- Monopoly regulation. One possibility is for a firm to have a monopoly situation, but the government sets up a regulator to prevent the excesses of monopoly power. For example, utilities like water and gas are natural monopolies so it makes sense to have one provider. The regulator can limit price increases and ensure standards of service are met. In theory, this enables the best of both worlds – the monopoly firm can benefit from economies of scale, but the consumer is protected from monopoly prices.
- However, it depends on the quality of regulation. There is a danger of regulatory capture and the regulator allowing the firm to be too profitable.
- See also: Regulation of monopoly
- Subsidise loss-making services. Another potential advantage of a monopoly is that they can use their supernormal profit to subsidise socially useful but loss-making services. For example, a train company can use its monopoly power to set high prices on peak services, but this allows the firm to subsidise unprofitable late-running services on Sat night, which is useful for people going out for the night.
- Avoid the duplication of services. In some areas, the most efficient number of firms is one. For example, if a city deregulates its bus travel, then rival bus companies may compete for profitable peak-hour services. This may lead to increased congestion as several buses turn up at once. It is more efficient to have a monopoly and avoid this inefficient duplication of services.
Examples of industries where monopoly is the best option
Electricity distribution. To distribute electricity to every home in a country, it is most efficient to have a monopoly provider. There are significant economies of scale in having a comprehensive network. There is no point in having two electricity cables running up the same street.
Bus travel in a city. Avoids duplication and enables efficient timetabling.
Pharmaceutical drug provision. The promise of a patent on a drug is sufficient to encourage firms to invest in developing new drugs.
Nuclear power generation. An industry with very high fixed cost and need to set very high safety standards. It shouldn’t need competition between different power plants to get best outcome.
Evaluation of monopolies
- It depends on the industry in question. For example, a monopoly is needed in a natural monopoly like tap water. However, for restaurants, there are no significant economies of scale and it is important to have a choice. Therefore monopoly would be very inappropriate for restaurants.
- Some industries need a lot of research and development (e.g. building new aeroplanes, research drugs). Therefore, a monopoly may be needed in this industry.
- A government may be able to regulate monopolies to gain benefits of economies of scale, without the disadvantages of higher prices.
How monopolies can develop
- Horizontal Integration. Where two firms join at the same stage of production, e.g. two banks such as TSB and Lloyds
- Vertical Integration. Where a firm gains market power by controlling different stages of the production process. A good example is the oil industry, where the leading firms produce, refine and sell oil.
- Legal Monopoly. E.g. Royal Mail or Patents for producing a drug.
- Internal Expansion of a firm. Firms can increase market share by increasing their sales and possibly benefiting from economies of scale. For example, Google became a monopoly through dominating the search engine market.
- Being the first firm e.g. Microsoft has created monopoly power by being the first firm.
Monopolies also need barriers to entry to protect them from new firms entering the market. Barriers to entry can include – brand loyalty through advertising and economies of scale
Good Monopolies
- Tap Water
- Apple?
Bad Monopolies
- Rockefeller – Standard Oil
- Microsoft in 1980s – keeping out competition by pre-installing Microsoft software packages.
- Facebook? Does Facebook have too much power over our personal data and ability to allow fake news into social media feeds?
Regulation of monopoly
The government may wish to regulate monopolies to protect the interests of consumers. For example, monopolies have the market power to set prices higher than in competitive markets. The government can regulate monopolies through:
- Price capping – limiting price increases
- Regulation of mergers
- Breaking up monopolies
- Investigations into cartels and unfair practises
- Nationalisation – government ownership.
Why the Government regulates monopolies
- Prevent excess prices. Without government regulation, monopolies could put prices above the competitive equilibrium. This would lead to allocative inefficiency and a decline in consumer welfare.
- Quality of service. If a firm has a monopoly over the provision of a particular service, it may have little incentive to offer a good quality service. Government regulation can ensure the firm meets minimum standards of service.
- Monopsony power. A firm with monopoly selling power may also be in a position to exploit monopsony buying power. For example, supermarkets may use their dominant market position to squeeze profit margins of farmers.
- Promote competition. In some industries, it is possible to encourage competition, and therefore there will be less need for government regulation.
- Natural Monopolies. Some industries are natural monopolies – due to high economies of scale, the most efficient number of firms is one. Therefore, we cannot encourage competition, and it is essential to regulate the firm to prevent the abuse of monopoly power.
How the government regulate monopolies
1. Price capping by regulators RPI-X
For many newly privatised industries, such as water, electricity and gas, the government created regulatory bodies such as:
- OFGEM – gas and electricity markets
- OFWAT – tap water.
- ORR – Office of rail regulator.
Amongst their functions, they are able to limit price increases. They can do this with a formula RPI-X
- X is the amount by which they have to cut prices by in real terms.
- If inflation is 3% and X= 1%
- Then firms can increase actual nominal prices by 3-1 = 2%
If the regulator thinks a firm can make efficiency savings and is charging too much to consumers, it can set a high level of X. In the early years of telecom regulation, the level of X was quite high because efficiency savings enabled big price cuts.
RPI+/- K – for water industry
In water, the price cap system is RPI -/+ K.
K is the amount of investment that the water firm needs to implement. Thus, if water companies need to invest in better water pipes, they will be able to increase prices to finance this investment.
Advantages of RPI-X Regulation
- The regulator can set price increases depending on the state of the industry and potential efficiency savings.
- If a firm cut costs by more than X, they can increase their profits. Arguably there is an incentive to cut costs.
- Surrogate competition. In the absence of competition, RPI-X is a way to increase competition and prevent the abuse of monopoly power.
Disadvantages of RPI-X Regulation
- It is costly and difficult to decide what the level of X should be.
- There is a danger of regulatory capture, where regulators become too soft on the firm and allow them to increase prices and make supernormal profits.
- However, firms may argue regulators are too strict and don’t allow them to make enough profit for investment.
- If a firm becomes very efficient, it may be penalised by having higher levels of X, so it can’t keep its efficiency saving.
2. Regulation of quality of service
Regulators can examine the quality of the service provided by the monopoly. For example, the rail regulator examines the safety record of rail firms to ensure that they don’t cut corners.
In gas and electricity markets, regulators will make sure that old people are treated with concern, e.g. not allow a monopoly to cut off gas supplies in winter.
3. Merger policy
The government has a policy to investigate mergers which could create monopoly power. If a new merger creates a firm with more than 25% of market share, it is automatically referred to the Competition and Markets Authority (CMA). The CMA can decide to allow or block the merger depending on whether it believes it is in the public interest.
- For example, CMA blocked the merger between Sainsbury’s and Asda as being against the public interest.
4. Breaking up a monopoly
In certain cases, the government may decide a monopoly needs to be broken up because the firm has become too powerful. This rarely occurs. For example, the US looked into breaking up Microsoft, but in the end, the action was dropped. This tends to be seen as an extreme step, and there is no guarantee the new firms won’t collude.
5. Yardstick or ‘Rate of Return’ Regulation
This is a different way of regulating monopolies to the RPI-X price capping. Rate of return regulation looks at the size of the firm and evaluates what would make a reasonable level of profit from the capital base. If the firm is making too much profit compared to their relative size, the regulator may enforce price cuts or take one-off tax.
A disadvantage of the rate of return regulation is that it can encourage ‘cost padding’. This is when firms allow costs to increase so that profit levels are not deemed excessive. Rate of return regulation gives little incentive to be efficient and increase profits. Also, rate of return regulation may fail to evaluate how much profit is reasonable. If it is set too high, the firm can abuse its monopoly power.
6. Investigation of abuse of monopoly power
In the UK, the office of fair trading can investigate the abuse of monopoly power. This may include unfair trading practices such as:
- Collusion (firms agree to set higher prices)
- Collusive tendering. This occurs when firms enter into agreements to fix the bid at which they will tender for projects. Firms will take it in turns to get the contract and enable a much higher price for the contract.
- Predatory pricing (setting low prices to try and force rival firms out of business)
- Vertical restraints – prevent retailers stock rival products
- Selective distribution For example, in the UK car industry firms entered into selective and exclusive distribution networks to keep prices high. The competition commission report of 2000 found UK cars were at least 10% higher than European cars
Collusion – meaning and examples
Collusion occurs when rival firms agree to work together – e.g. setting higher prices in order to make greater profits. Collusion is a way for firms to make higher profits at the expense of consumers and reduces the competitiveness of the market.

In the above example, a competitive industry will have price P1 and Q competitive. If firms collude, they can restrict output to Q2 and increase the price to P2.
Collusion usually involves some form of agreement to seek higher prices. This may involve:
- Agreeing to increase prices faced by consumers.
- Deals between suppliers and retailers. For example, vertical price-fixing e.g. retail price maintenance. (For example, Fixed Book Price (FBP) set the price a book is sold to the public.
- Monopsony pricing – where retailers collude to reduce the amount paid to suppliers. For example, a retailer with great buying power (Walmart, Amazon) can offer very small profit margins to suppliers as they have little alternative.
- Collusion between existing firms in an industry to exclude new firms from deals to prevent the market from becoming more competitive.
- Sticking to output quotas and higher prices.
- Collusive tendering. For example, ‘cover prices’ for competitive tendering in bidding for public construction contracts. This is when a rival firm agrees to set artificially high price to allow the firm of choice to win with a relatively high contract offer.
Types of collusion
- Formal collusion – when firms make formal agreement to stick to high prices. This can involve the creation of a cartel. The most famous cartel is OPEC – an organisation concerned with setting prices for oil.
- Tacit collusion – where firms make informal agreements or collude without actually speaking to their rivals. This may be to avoid detection by government regulators.
- Price leadership. It is possible firms may try to unofficially collude by following the prices set by a market leader. This enables them to keep prices high, without ever meeting with rival firms. This kind of collusion is hard to prove whether it is unfair competition or just the natural operation of markets.
Problems of collusion
Collusion is seen as bad for consumers and economic welfare, and therefore collusion is mostly regulated by governments. Collusion can lead to:
- High prices for consumers. This leads to a decline in consumer surplus and allocative inefficiency (Price pushed up above marginal cost)
- New firms can be discouraged from entering the market by types of collusion which act as a barrier to entry.
- Easy profits from collusion can make firms lazy and avoid innovation and efforts to increase productivity.
- Industry gets the disadvantages of monopoly (higher price) but none of the advantages (e.g. economies of scale)
Justification for collusion
- In times of unprofitable business conditions, collusion may be a way to try and save the industry and prevent firms from going out of business, which wouldn’t be in the long-term consumer interest. Dairy suppliers tried to use this justification in 2002/03 after problems from foot and mouth disease led to a decline in farm incomes.
- Research and development. Profits from collusion could, in theory, be used to invest in research and development.
Examples of collusion
Milk price by supermarkets 2002-03
After a period of low milk, butter and cheese prices, supermarkets such as Asda and Sainsbury’s colluded with Dairy suppliers, Dairy Crest and Wiseman Dairies to increase the price of milk, cheese and other dairy products in supermarkets. After an OFT investigation, supermarkets and suppliers were fined a total of £116m.
The OFT found prices set by supermarkets went up by three pence per pint of milk, but the income received by farmers did not go up. Milk collusion at BBC
Bank loans collusion – RBS and Barclays 2008-2010

In 2010 the OFT found RBS and Barclays guilty of collusion in sharing price arrangements for loans to professionals, such as lawyers and accountants. Sharing price information is a way to avoid price competition and keep prices high. RBS was fined £28.59m. (Independent)
Recruitment agencies forum cartel 2004-06
Between 2004 and 2006 six recruitment companies formed a cartel called the “Construction Recruitment Forum” which met to fix prices for supplying labour to intermediaries and construction companies. They also excluded a new firm Parc from any dealings. Hays was fined £30.4 million for a ‘Serious breach of competition law.’ BBC link
Collusion in the construction industry – collusion on tender price
In bidding for public sector construction work, construction firms would collude in setting artificially high prices. Firms would decide which contracts they wanted, and rivals would bid purposefully high price. This is a practice known as “Cover pricing”. Successful companies would often reward rivals with a secret payment for avoiding competition.
During the investigation, the OFT found 199 offences where the 103 companies artificially inflated £200m worth of work. Companies were fined a total of £129.5m by the OFT. Guardian link.
Price fixing in air travel – British Airways and Virgin 2004-06
In 2007, British Airways was fined £270m for illegal price-fixing arrangements with Virgin on long haul flights. The two companies met to agree and collude on the extra price of fuel surcharges in response to rising oil prices. Between 2004 and 2006, surcharges on air tickets rose from £5 to £60 per ticket. The £270m fine compares to an annual profit of £611m for BA. BBC link on collusion.
Collusion over hiring practises.
In 2015, Apple and Google were investigated for an agreement between the two companies where they agreed not to hire staff from the other company. This was an attempt to prevent wage spirals due to workers moving between the companies. The companies agreed to make a settlement rather than take it to court.
Regulation for collusion
In the UK, the Competition Act of 1998, states the OFT has the power to impose penalties on companies of up to 10 per cent of their worldwide turnover for breaches of competition law.
Firms which act as whistleblowers can gain immunity from penalties. Therefore, if two firms are colluding there is an incentive to be the first to blow the whistle and give information to the OFT.
Game theory and collusion

- If firms are competitive and they set low price -they will both make £4m.
- If they collude and set high price, then they will both double their profits and make £8m.
- However, if during collusion, firm A undercuts the collusive price and sets a low price – it is able to sell more. In this case, firm A benefits from the best of both worlds. Prices are high because firm B is setting high price, but firm A is also selling large quantity because it is undercutting its rival. In this case, firm A makes £10m and firm B only makes £2m.
- Therefore, firm B is unlikely to keep prices high and the market reverts to both setting low prices.
The optimal outcome for the firms is to collude (high price, high price) However, whether this occurs depends on whether there are incentives to keep colluding
- For example, legal restrictions on collusion can make it unstable. If a firm reports the collusion to the regulator, then the firm is immune from being fined; it is the other firm which will suffer. Therefore, in collusion, there is a strong incentive to be first to confess. It is a very risky strategy to continue with the collusion, hoping the other firm won’t run to the regulator.
- This is why the law is designed as it is – with a strong incentive to be the one to confess. The downside is that firms who collude for a long-time can be immune from prosecution and being fined.
Government policies to reduce collusion
Collusion involves firms coming to an agreement to artificially raise prices and increase profitability at the expense of consumers. Collusion can lead to significant welfare loss and governments have sought to prevent it through a variety of policies, including:
- Fines for firms found guilty of collusion
- Fines and jail sentences for company executives who are personally liable.
- Detecting collusion through screening markets for suspicious pricing activity and high profitability.
- Offering immunity to the first firm who comes clean and gives the government information about collusion. This is known as ‘leniency programmes’
- Regulation of mergers. Preventing mergers which lead to high concentration ratios, where collusion is more likely.

Preventing collusion
1. Detection through leniency programmes. To prevent collusion, governments first have to detect it. In a paper “Cartels as Rational Business Strategy: Crime Pays”(2011) by Connor and Lande, they argue the chance of a cartel being detected is as low as one in five. This is because if firms are careful, they can collude without leaving any evidence.
In the US, the Department of Justice has investigative powers and in the EU it is the EU Commission. Mostly the commissions rely on tip-offs. One way to detect collusion is to give firms a strong incentive to give information to the government. The US brought in a law that the first firm who gives information on a cartel are immune from criminal charges and penalties. The 2nd and 3rd firm who co-operate do not get immunity but significantly lower sentences. The strength of this policy is that it creates uncertainty amongst colluders because – if in doubt – it makes sense to confess early and avoid charges.
- However, a leniency programme on its own is not sufficient to prevent collusion. If firms are patient and think the probability of getting fined is less that profitability of collusion. W. Emons (2018) argues that leniency may or may not prevent collusion when firms can choose the degree of collusion “The effectiveness of leniency programs when firms choose the degree of collusion.“
2. Higher fines. The European cement industry was investigated for collusion. The Economist notes a report from the investigation that an executive said “… it’s hard to stop fixing prices when it’s still so worthwhile.” In “Cartels as Rational Business Strategy: Crime Pays” (2011) the authors claim that sanctions for collusion only accounts for a small percentage of the extra profits gained from collusion. They estimate the penalty for collusion is only 9% to 21% as the rewards from collusion. Therefore, there is a clear financial incentive for firms to collude. A firm weighs up the
Net gain from collusion = Extra profits from collusion – (Penalty * chance of being caught).
The authors claim
“collusion remains a rational business strategy. Cartelization is a crime that on average pays. In fact, it pays very well.” – Connor and Lande, 2012.
In this case, higher fines would make collusion less rational. Combined with leniency programmes, it increases the incentive to be a whistleblower and avoid the heavy fines. The higher fines would also compensate consumers for loss of economic welfare from the period of collusion.
However, some firms have argued that fines from collusion are excessive and could in some cases bankrupt firms causing a decline in competition.
An example of major fines was in 2012 – major tv producers were given record fines for collusion in the provision of cathode-ray tubes causing the price of tv sets to rise. The European Commission (EC) passed a total of fines worth €1.4bn (£1.1bn) to several firms including Philips, Samsung, SDI, LG, Panasonic and Toshiba. Phillips said it would challenge what is considered a disproportionate and unjustified penalty. (Link)
In addition to government fines, the increased threat of civil litigation creates another financial cost of collusion.
3. Hold executives personally responsible. The US leads the way for holding executives personally responsible for engaging in illegal collusion. The personal threat of jail and a criminal record is much greater than the personal rewards of increasing firms profits. Given even a small risk of getting sent to jail, it is a large disincentive to take the risk of collusion. In the UK an executive can face up to five years in jail for cartel activity (though it is rarely imposed) After the LIBOR price-fixing cartel was exposed, major banks were fined large sums (Barclays fined £200m by CFTC, $160 million by the US D of J and £59.5 million by the FSA. Four former Barclays bank employees were sentenced to a total of 17 years. (SFO)
4. Screening of suspicious pricing behaviour. Modern technology enables governments to monitor suspicious pricing patterns which may indicate collusion and further investigation. This may need to be combined with information on profitability. For example, it can become hard to distinguish between normal price changes (e.g. airlines adjusting prices depending on demand) to formal collusion. Suspicious pricing behaviour was significant in the Libor scandal when it was shown banks were falsely inflating their rates to profit from trades.
This financial screening has become more viable with improvements in technology and AI logarithms. However, it works best in industries with substantial data. It also has limitations – firms could manipulate data. More worryingly it can easily lead to false positives. The US Department of Justice tried “screeing: but had to ditch it after too many false positives were created.
5. Increasing the enforcement budget. In 2012, the Department of Justice gained in revenue from fines 16 times more than the cost of running it. A bigger budget would enable more scrutiny and discourage collusion.
6. Regulation of mergers. Collusion is more likely in certain markets with similar products, easy to check prices, barriers to entry and often low-visible components (rather than retail end products) In these industries vulnerable to collusion, mergers must be closely monitored and blocking any merger which leads to significant fall in competition. In extreme cases, governments could consider splitting up powerful monopolies to try and increase competition.
Predatory Pricing
Definition of Predatory Pricing
Predatory pricing occurs when a firm sells a good or service at a price below cost (or very cheaply) with the intention of forcing rival firms out of business.
- Predatory pricing could be a method to deal with new firms who enter an industry.
- If a monopoly is enjoying supernormal profits, it is likely to attract new firms into the industry – who would reduce the incumbent’s profitability.
- However, in response, the incumbent monopoly could cut prices and make a temporary loss.
- These low prices and operating at a loss may force the new firm out of business.
- The incumbent monopoly may have significant savings to finance a price war, whilst the new firm is more vulnerable due to financing cost of entering the market.
- If successful, the monopoly firm regains its monopoly power, but also its action of predatory pricing discourages other firms from trying to enter.
Predatory Pricing and the Public Interest
If predatory pricing leads to an increase in monopoly power, then it will harm the public interest because it leads to higher prices in the long term. However, predatory pricing could be confused with a very competitive market. Consumers can benefit if prices fall and all the firms stay in business.
Predatory Pricing and Regulation
Predatory pricing in the UK is illegal. It is prohibited under EU Competition Law to sell goods at a loss with the purpose of forcing other firms out of business.
Example of Predatory Pricing
Darlington Bus wars (1994)
In the Darlington bus wars, Busways (owned by Stagecoach from July 1994) a new entrant into the deregulated bus markets, offered free bus travel to try and force the rival Darlington Bus company out of business. Busways were also successful in attracting bus drivers from its rival (by paying higher wages. For a time, they also offered free bus rides – attracting customers from their rivals The result was that Darlington Transport Company (DTC) went out of business leading to monopoly power for the remaining Busways company.
In a report into the entry of Busways, the Monopolies and Mergers commission reported that the actions of Busways did amount to predatory pricing. (Report by MMC)
“It was the combination of Busways’ actions in recruiting so many of DTC’s drivers so quickly, registering services on all its routes and running free services which caused DTC’s final collapse. We find these actions to be predatory, deplorable and against the public interest.”
Since bus deregulation, bus use in Darlington has fallen from 10 million journeys a year (2001) to 6.6 million (2014).
Aberdeen Journals
Aberdeen Newspaper was fined by the OFT for predatory pricing and trying to eliminate its main competitor. Aberdeen Journals were fined £1.3million.
‘Aberdeen Journals deliberately incurred losses in a persistent campaign to remove its only direct rival from the market. This campaign continued despite the fact that the Competition Act 1998 prohibited predatory pricing from March 2000, and despite an OFT investigation already being in train. This was a serious infringement of the law, and the penalty should act as a deterrent to others.’ [OFT link]
Microsoft web browser – internet explorer
Microsoft’s decision to offer its web browser (Internet Explorer) helped to make it very difficult for its main competitor (Netscape) who was also forced to offer its web browser for free.
Partial Predatory Pricing
Often firms engage in partial predatory pricing. This could be termed ‘loss leaders’ For example, supermarkets sell some items like bread and baked beans at a discount to attract customers. But, overall they remain profitable.
Inequality in the UK
In the nineteenth century, the UK was characterised by high levels of income inequality. However, from the start of the twentieth century until 1978, there was a steady fall in inequality and reduction in poverty (both relative and absolute). However, the 1980s saw a sharp rise in inequality which has not been reversed in the 1990s and 2000s.
Reasons for post-war fall in inequality
- Welfare state – benefits for the unemployed, sick
- Higher income taxes on high earners
- Period of full employment
- Rising wages for the working class.
- Erosion of class privileges
- Improvement in universal education and universal health care.
- See also: post-war economic boom
Income inequality measured by disposable income
The gini coefficient is a measure of income inequality. It measures the ratio in a https://www.economicshelp.org/blog/glossary/lorenz-curve/Lorenz curve between the line of equality and line of actual income. A ratio of 100% is extreme inequality a ratio of 0% is perfect equality.
The below graph shows the rise in inequality from 1978 to 1992.
Gini coefficient is one popular method of measuring inequality but it doesn’t always reflect how the inequality is distributed.

Source: ONS
Reasons for rise in income inequality during the 1980s
- Reduced power of trade unions
- Decline in manufacturing and relatively high paying manual labour
- Rise in service sector jobs characterised by short-term contracts, flexible hours.
- Reduction in higher income tax rates
- Benefits index linked means benefits rose more slowly than average wages
- Growth in financial sector and number of high paying jobs in the industry.

Source: ONS
Income inequality of top 1%

From mid-1970s to late 1990s, there was a sharp reversal in income inequality, especially the top 1% saw a marked increase in the share of overall income. This was because:
- Growth of financial sector and growth in wages for high earners
- Privatisation and deregulation, especially deregulation of financial sector
- Growth in asset prices (houses) which increased wealth inequality
- Decline of manufacturing industry and rise in long-term unemployment
- Growth in wage inequality
- Cut in higher rates of income tax
Inequality in UK compared
The UK has one of the highest levels of inequality in the developed world.

Source: IFS
Historical inequality
Data from the past is harder to find.

The inverted Pareto – Lorenz coefficient is a measure of inequality.
Note there are gaps in the series. The measure of inequality was highest in 1910 at 2.9
This measure of inequality fell sharply after the war before increasing from 180.
Income share of top 1%

Relative Poverty
Since 1997, there has been a fall in absolute low income. Relative low income has only d

The number of people living in relative poverty (defined as income 60% of median average incomes) stands at 12.8 million (after housing costs) This is approximately 21% of the population, down from 25% in 1997 (poverty and inequality in the UK 2007)
Factors that may have contributed to increased inequality in the UK in recent years
1. An increase in the number of people on benefits. Despite falling unemployment, the number of people receiving state benefits is still around 5 million. There has been an increasing number of people on state benefits such as sickness and incapacity benefits. Arguably there is disguised unemployment. This means that many people have lower incomes.
2. Rising property values have reduced disposable incomes for many young people. Rising property values have made renting more expensive. Therefore, an increasing % of incomes has been spent on housing costs. There has also been an undeniable increase in wealth inequality, which often leads to income inequality.
3. There has been an increase in part-time /temporary work. This work is not protected by trades unions and tends to be low paid.
4. The minimum wage is limited in its ability to reduce inequality. Many of those who benefit from the NMW are second income earners or students who are not particularly poor.
5. Increase in regressive indirect taxes. Taxes on alcohol, petrol and cigarettes have increased faster than inflation. Therefore, they have been taking a higher % of people’s disposable income. This has particularly affected groups such as the single unemployed.
6. Inflation for pensioners has been higher than the CPI rate. This is because pensioners spend a higher % of income on goods like council tax, fuel and food; these goods have been increasing faster than inflation, leaving pensioners relatively poorer.
Fuel Poverty
Fuel poverty occurs when households have to spend more than 10% of their income on maintaining the home at a reasonable temperature.

OECD Report
An OECD report suggested, according to the Gini coefficient, inequality had grown in the UK quicker than anywhere else.
In Britain, the gap in earnings between the richest and poorest in the working-age population has risen from eight to one in 1985 to 12 to one in 2008.
Workers in the top tenth now earn an average £55,000 a year, compared with £4,700 for the poorest 10 percent.
Using a measurement which works out how well income is distributed throughout society, known as the Gini coefficient, inequality has risen faster in Britain than in any other country since 1975.
The reason for this increase is mainly down to the fact that the share of total income taken by the richest 1 percent has doubled, from 7.1 percent in 1970 to 14.3 percent in 2005. Within this group, the super-rich 0.1 percent of top earns took some 5 percent of total pre-tax income.
Welfare State
However, the OECD also pointed out that UK government spending on health and education had the impact of helping to reduce effective inequality.
Wealth Inequality

The Lorenz curve shows the cumulative wealth of each wealth decile. It shows that the lowest 38% of individuals have zero property wealth. The top 10% own nearly 50% of property wealth.
With financial wealth, the inequality is even greater. WIth 60% of the population in debt and negative wealth. The top 10% have 80% of the nations financial wealth.
Source:
- Wealth in Great Britain ONS, published July 2012
Other graphs of inequality


This shows inequality measured by the ratio of top 20% richest people to bottom 20%. Since 1991, there has been a minor reduction in this level of poverty.
Factor immobility
Factor immobility occurs when it is difficult for factors of production (e.g. labour and capital) to move between different areas of the economy. Factor immobility could involve:
- Geographical immobility – When it is difficult to move from one geographical area to another.
- Occupational immobility – difficult to move from one type of work to another.

Geographical immobility
Unemployment in South Wales may be very high, but there could still be job vacancies in London. Why is it difficult for the unemployed in South Wales to move to London and South East of England?

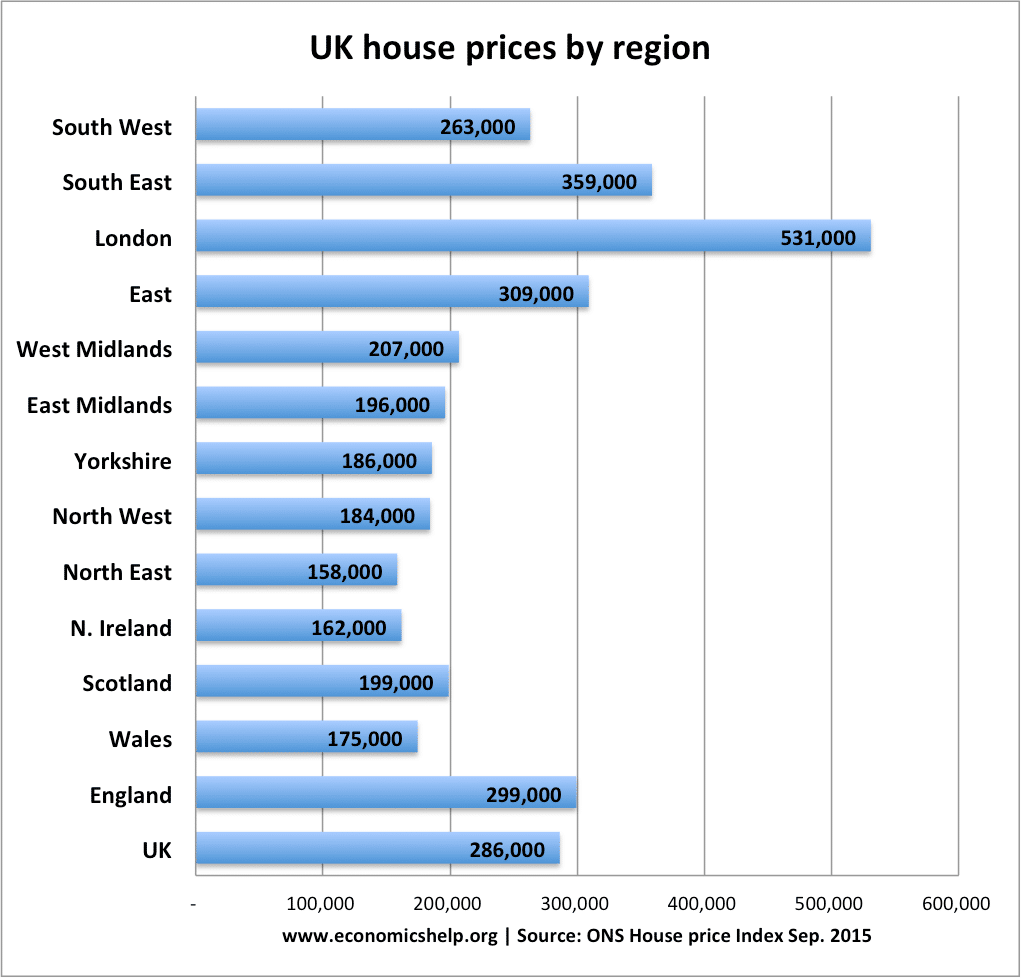
- Cost of moving/difficulty in finding accommodation. If you sold a house in Wales for £175,000, you wouldn’t be able to afford anything in London because of the higher house prices. Therefore the cost of buying or even renting may prohibit a worker from moving to areas with higher demand for workers.
- Lack of information. It may be difficult for the unemploymed to know about available jobs and available accommodation.
- Personal ties. An unemployed worker may have family and social ties in his place of birth. He may have children in school or partner in employment. All this makes it difficult to move.
- Within the Eurozone, there is even greater geographical immobility because of the difficulties in moving between countries, where different languages are spoken.
Policies to overcome geographical immobility
- Improve the quality and quantity of rented accommodation in employment hotspots. For example, building more council houses in London and the south. However, this may be difficult because there is limited space in London and there is already congestion and overcrowding.
- Move jobs out of London. The government has moved many public agencies out of London, for example, DVLA was moved to Swansea. The idea is to move jobs out of London – creating jobs in Wales and shifting demand from London.
- Improved transport links. High-speed railway lines into London may enable people to commute from longer distances.
Reasons for occupational immobility
If coal mines or steel factories closed down in South Wales, it may be very difficult for the unemployed coal miners to find work in new industries in the service sector.
- They may lack relevant skills/confidence or motivation to work in completely new industries.
- It may be difficult to receive training in areas where jobs are available.
- People over a certain age (e.g. 55) may be pessimistic about their chances to learn new skills in higher-tech industries.
Reasons for capital immobility
- If there is a rapid structural change in the economy. It may take time to alter machines and capital to keep up to date with changing nature of the economy.
Importance of factor immobility
- Globalisation is accelerating economic changes. Companies are outsourcing production to lower labour cost economies, causing disruptions in labour markets.
- Factor immobility is causing structural unemployment and/or lower wages – especially for manual workers who lose their jobs.
- Economic inefficiency. Factor immobility leads to resources being underused and causing a Pareto inefficient outcome.
- Factor immobility is a cause of market failure. The free market fails to provide an efficient allocation of resources because of the geographical and occupational immobilities.
- Inequality. Factor immobility can lead to increased inequality. This has occurred in past three decades.
Policies to overcome factor immobility
- Improve the provision of information
- Subsidise firms to move to depressed areas.
- Education and retraining for workers who don’t have relevant skills.
Problems of Agriculture – Market Failure

Types of market failure in agriculture
- Volatile Prices / volatile supply
- Low and volatile income for farmers
- Environmental costs of intensive farming (negative externalities)
- Agriculture key component of rural life (positive externalities)
- Monopsony power of food purchasers.
Volatile Prices in Agriculture
Prices in agricultural markets are often much more volatile than other industries. This is because:
- Supply is price inelastic in the short term. (It takes a year to grow most crops)
- Demand is price inelastic. (Food is essential, and people are not usually put off by higher prices)
- Supply can vary due to climatic conditions.
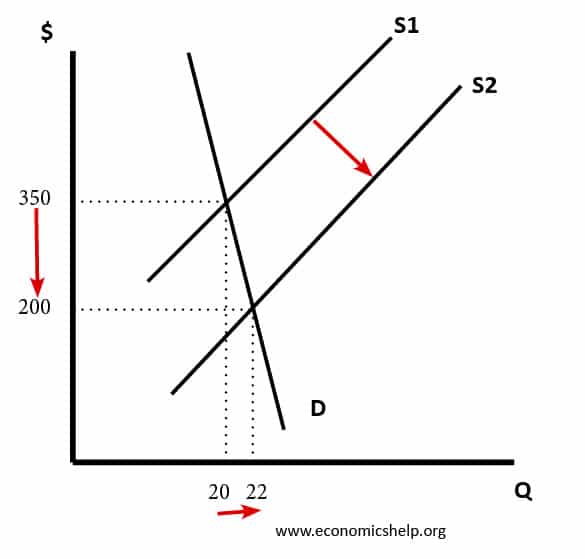

This diagram shows that a ‘good’ harvest leads to an increase in supply. This leads to a significant fall in price ($350 to $200). See also volatile food prices
The problem of volatile prices is that:
- A sharp drop in price leads to a fall in revenue for farmers. Farmers could easily go out of business if there is a glut in supply because prices can plummet below cost.
- Cobweb theory. The cobweb theory suggests prices can become stuck in a cycle of ever-increasing volatility. E.g. if prices fall like in the above example. Many farmers will go out of business. Next year supply will fall. This causes price to increase. However, this higher price acts as an incentive for greater supply. Therefore, next year supply increases and prices plummet again!
- In some years, consumers can be faced with a rapid increase in food prices which reduces their disposable income.
2. Low income for farmers
Often farmers don’t share the same benefits of economic growth. As the economy expands, firms don’t see a similar increase in income. Food has a low-income elasticity of demand. As incomes rise, people don’t spend more on food. Also, technological advances can lead to falling prices rather than rising incomes. Many developed economies feel it is necessary to subsidise farmers to protect their incomes.
For a developing economy, their current comparative advantage may lie in producing primary products. However, these may have a low-income elasticity of demand. With global growth, the demand for agricultural products doesn’t increase as much as manufacturing. Therefore, relying on agriculture can lead to lower rates of economic growth.
3. Environmental costs of intensive farming
Modern technology has enabled increased crop yields. However, this often requires chemical fertilizers which cause pollution. As farming becomes more competitive, there is a greater pressure to produce more leading to increased use of chemicals. However, artificial fertilizers have diminishing returns, so it becomes more expensive and greater environmental cost for little benefit. Many farming methods have led to deforestation and cutting down trees. This can upset the eco-balance making regions more susceptible to flooding.
4. Positive externalities of farming
You could argue farming communities play an integral role in rural life. If farmers go out of business, it has adverse consequences for rural communities and the environment they live in. This is often a justification for subsidising farmers (e.g. the social benefit of subsidising sheep farmers in the Lake District)
5. Monopsony
Supermarkets can have monopsony buying power over local farmers. This means farmers may see their profit margins squeezed by the big supermarkets who have substantial buying power. If farmers don’t sell to the big supermarkets they can’t sell their products; this is why it puts them in a difficult position.
Government intervention in agriculture
- Buffer stocks – to help stabilise prices though having minimum and maximum prices
- Minimum prices – to guarantee farmers basic income by subsidising food prices. However, minimum prices may encourage oversupply and lead to wasted food production.
- Subsidies for farmers who follow more environmentally friendly methods.
- Tariffs on imports. This increases the domestic price of agricultural produce, but leads to lower trade.
Problems of government intervention in agriculture
- Cost of subsidising agriculture in the developed world It is estimated support to agricultural producers in advanced countries was $245 billion in 2000, five times total development assistance. In the members of OECD as a whole, a third of farm income came from government mandated support in 2000. (Martin Wolf, Financial Times, 21 November 2001) (problems of Agriculture)
- Subsidies have often been given to farmers with large amounts of land and with little incentive to follow more environmentally friendly procedures.
- Minimum prices have led to over-supply
- Tariffs on agriculture have led to lower income for food exporters in the developing world and have been a big stumbling block to trade.
Комментариев нет:
Отправить комментарий