Показаны сообщения с ярлыком exhibits. Показать все сообщения

суббота, 3 декабря 2016 г.

Timeline Chart


We used a time line chart again in a recent steering committee document for one of our a-connect projects. They can be quite powerful to summarize key information in a succinct way, This information could relate to a specific product line or business unit, to key events of an acquisition target, or to the history of a company’s presence and growth in a geographic market. Time line chart allow you to group information in various ways. The example below distinguishes between internal and external events:

Other ways to structure and group relevant data points:
  • On the external side: PEST (political, economic, social, technological), Porter 5 Forces, etc.
  • On the internal side: 4Ps (product, promotion, place, price), etc.
I also find it helpful sometimes to overlay the relevant revenue picture (by product line, region, company, etc.) behind the time line chart, to put the key elements in perspective visually.
Note that there are ways to automatically create time line charts in MS Excel (see link - https://www.vertex42.com/ExcelArticles/create-a-timeline.html).

пятница, 25 ноября 2016 г.

Change Management Phases


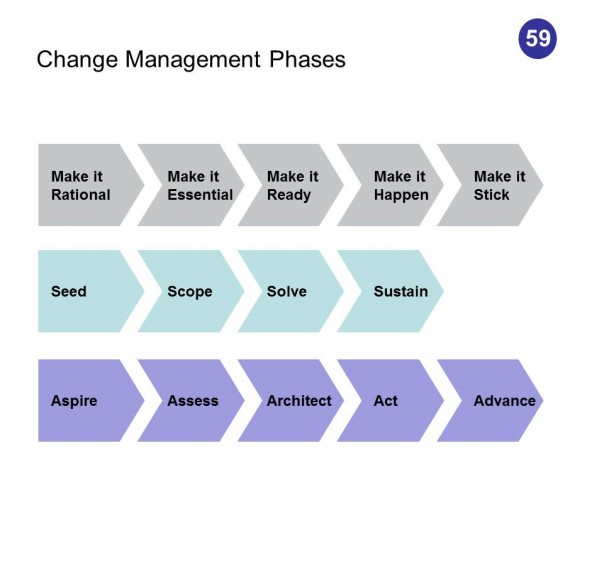
There are numerous ways to structure and describe the phases an organization will go through in the course of a change management process or transformation program. I have written about one of these frameworks in an earlier blog post (link): the catchy “make it rational, make it essential, make it ready, make it happen, make it stick.”


Another one is the Seed, Scope, Solve, Sustain framework. Interestingly, a Google search does not yield an immediate source for this S alliteration – frankly I’m not quite sure anymore where I came across this four step approach.


A third way to describe change management phases is described in a recently published book called “Beyond Performance” by Scott Keller and Colin Price (Wiley & Sons, 2011, link). The key elements described y Keller and Price:


• Aspire: Where do we want to go? What is the change vision and overall objectives that are most meaningful to the organization?


• Assess: How ready is the organization to go there? What is the organization’s ability to achieve its vision and targets?


• Architect: What must we do to get there? How can we develop a concrete, balanced set of performance improvement initiatives.


• Act: How do we manage the journey? What needs to happen in each initiative of the change management portfolio? What resources need to be dedicated to the various initiatives to make them successful?


• Advance: How do we keep moving forward? How can we develop a continuous improvement infrastructure to make sure this is not just a one-time change?

понедельник, 14 ноября 2016 г.

Diagram of Arguments


Hopefully, when you approach a strategic challenge, you’ll start this problem solving exercise by developing an issue tree, defining the various options, identifying the analyses necessary to support potential solutions, and then come up with a story line that reflects your issue tree and your findings. Standard problem solving approach that all consulting firms will teach you.
Sometimes you just have to present part of your issue tree in a presentation. It may not be the final presentation, but it may be a good way to get feedback from people on whether you have covered the critical areas. One way to do this is with a chart such as this “Diagram of Arguments” below.
You’ll take your key strategic challenge, list two or three potential solutions, a number of the critical arguments (both pro and con), as well as the supporting facts you have gathered so far. If you are 25% into your project, you should have gathered the relevant information to pull this together, and use it in additional interviews to test your hypotheses and make sure you didn’t miss anything.

пятница, 11 ноября 2016 г.

Ishikawa Diagram / Fishbone Chart


These diagrams are named after Kaoru Ishikawa, a Japanese professor and influential quality management expert. They were first started to be used in the 1940s, and are considered to be one of the seven important tools in quality management. They are alternatively referred to as Ishikawa diagrams, fishbone charts, cause and effect charts, or root cause diagrams. They are most frequently used in product design and manufacturing, analyzing defects or deviations and trying to identify the root causes.

The problem is stated in a box to the right of the diagram, and each major branch is devoted to some of the key issues that could have caused the problem. Major issues are generally grouped by people, materials, machinery, processes, measurements and external factors. But there is a whole art to grouping these major branches, and people have come up with standard groupings such as the 8 Ms, the 8 Ps, or the 4 Ss.


The 8 Ms (used in manufacturing)
  • Machine (technology)
  • Method (process)
  • Material (Includes Raw Material, Consumables and Information.)
  • Man Power (physical work)/Mind Power (brain work): Kaizens, Suggestions
  • Measurement (Inspection)
  • Milieu/Mother Nature (Environment)
  • Management/Money Power
  • Maintenance
The 8 Ps (used in service industry)
  • Product=Service
  • Price
  • Place
  • Promotion/Entertainment
  • People(key person)
  • Process
  • Physical Evidence
  • Productivity & Quality
The 4 Ss (used in service industry)
  • Surroundings
  • Suppliers
  • Systems
  • Skills
There is a great Wikipedia article on Ishikawa Diagrams (link), which provides a lot of context, questions to ask in each branch, and additional resources and links.

четверг, 10 ноября 2016 г.

4Q Methodology (Measure, Analyze, Improve, Control)

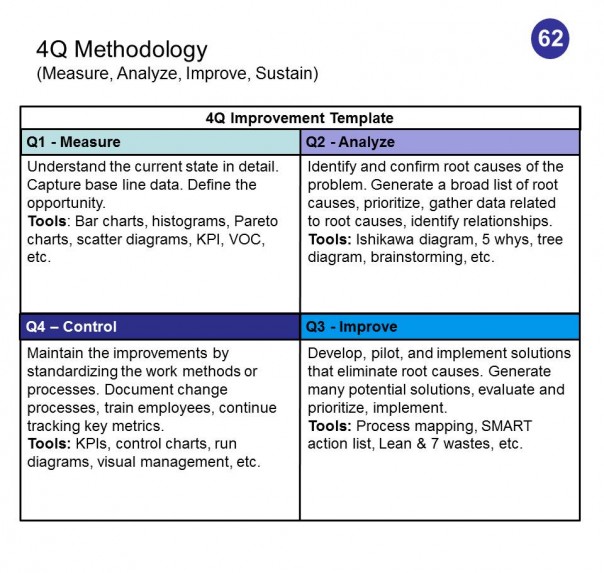
The “Measure – Analyze – Improve – Control” framework, sometimes also referred to as the 4Q (for 4 quadrants) methodology, is based on a classic six sigma methodology of problem solving. Some firms refer to the fourth quadrant as “Sustain,” but Control is used most often in six sigma literature. Also, other applications of the methodology use five phases, adding a “Define” phase at the beginning. So you may also find literature on the Internet under the acronym DMAIC (Define, Measure, Analyze, Improve, Control).


Sticking to the four most important quadrants:

Measure: The purpose of this step is to define the scope and the problem, and to learn about the current state, and capture the base line data. This includes, among other things: Creating a statement of the opportunity, understanding what the Customer wants. Identifying team members and time frames. Investigating the current situation in detail: Who, What, When, Where. Developing a detailed process map of the situation. And plotting baseline data over time to look for special causes. Outputs from this phase will typically include data that shows the problem’s location, baseline data, and a better understanding of the current process.

Analyze: The second step is focused on to identify the root cause(s) of the problem, and to find/prioritize/verify the greatest opportunity for improvement. This will include: Generating many potential causes or opportunities. Organizing and evaluating causes for greatest impact. Collecting data to verify the selected root cause or opportunity with greatest potential. And identifying the relationship between the selected cause and the process outcomes. Outputs from this phase will typically include identified root causes or improvements that have been tested and confirmed.

Improve: The purpose of the third step is to develop, pilot, and implement the solutions that address the root causes. This includes: Generating many potential solutions or improvements. Evaluating and selecting the best solution. Running a pilot if necessary. Implementing the best solution quickly. And measuring results and comparing them to the baseline to verify expected results were obtained. Output from this phase will typically include completed actions that eliminate or reduce the root cause of problems or implement improvements to the process.

Control: The purpose of the last step is to maintain the gains you have achieved with the project and make sure the process stays “in control.” This includes: Documenting changed work methods or processes. Training employees on the new methods. Summarizing results and communicating learnings to the organization. Identifying next steps for this process. Output from this last phase will generally include documentation of the new process or method being followed, communication of the results, and further recommendations of the team.

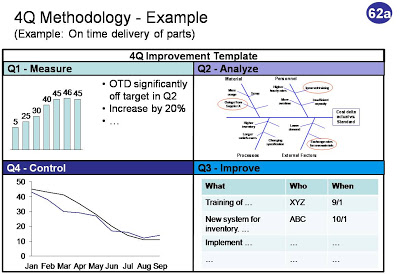
The chart above lists a number of specific statistical tools, six sigma concepts, frameworks and methodologies that can be applied in the various phases. And the chart below shows an example on how some of the key findings could be summarized on one page for a specific problem that needs to be solved.  


среда, 9 ноября 2016 г.

Pareto Chart


A Pareto Chart is a graph with both bars and a line, where the individual values of a data series are presented in vertical bars (generally in descending order), and the cumulative values are presented as an increasing, concave line. Often, the vertical axis on the left of the chart is used to depict the number of occurrences (or costs, or other metric), while the vertical axis on the right is used to show the percentage of total occurrences.

Pareto charts are often used in quality control, analyzing reasons for why defects are happening or why a process is not working properly. As a matter of fact, they are considered one of the key seven tools of Total Quality Control (TQC). A Pareto chart shows a quick highlight on what the key reasons are for a problem or issues (e.g. addressing the top two issues will help us solve xx% of the total defects). 
The chart is named after Vilfredo Pareto (1848 to 1923), an Italian engineer and economist who taught at the University of Lausanne in Switzerland. He was best known for his “Pareto distribution,” stating that the wealth distribution in a society generally follows a power law curve.  

суббота, 5 ноября 2016 г.

Scenarios


Many projects include the use of scenarios, and it’s often quite difficult to depict them graphically. Here is a good way to summarize at a high level four different scenarios, based on two key uncertainties.

Of course, the first task is to clearly define the uncertainties and driving forces. The framework is in some ways a good forcing mechanism to make sure that you really do pick uncertainties that are independent of each other. Shell is credited with being one of the first firms to use scenario planning extensively. So let’s use some oil industry examples: Some factors that affect the future are under a firm’s control: Do we want to focus on upstream or downstream operations or both? Do we want to be an industry leader by making acquisition, or a focused mid size player? Other factors can be forecasted with a certain degree of accuracy: What will GDP growth and oil consumption look like in China over the next ten years? But other factors are truly uncertain and present clear either-or outcomes: Will there be political turmoil or stability in key Middle East markets? Those are the critical driving forces and uncertainties to include in scenario planning.

Once you have identified the two most relevant uncertainties and driving forces, fill out the key scenarios in each quadrant. As an additional chart, you may want to add an overview in table format, listing the four scenarios at left, and then a number of columns describing them in more detail: Opportunities, threats, strategic implications, etc.

5 Why Analysis


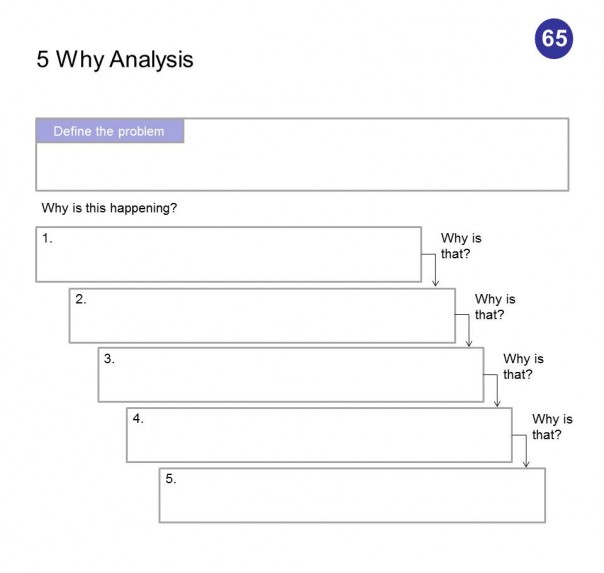
The 5 Why Analysis is a methodology used to investigate cause/effect relationships for a particular problem and identify a root cause. It is often used in the context of lean, six sigma, process improvement projects. Repeatedly asking the question “Why” allows you to peel away the layers of symptoms which can lead to the root cause of a problem. Note that the number 5 is a good rule of thumb, but some problems may take more or less levels to really get to the root cause. Also, sometime the underlying reason for a problem will lead to another question to be investigated.


The methodology is often applied with a fishbone or Ishikawa diagram, which allows you to lay out all the potential inputs and factors affecting a problem. The 5 Whys are a good way to then drill down into the details. The methodology is best used in a team setting, and it helps to discuss the various issues in depth and make sure the team comes away with an agreement before proceeding. Be careful not to “lead” the questioning in order to get to a preconceived answer.

Keep in mind also to think through reasons why a problem was not detected, and why the system allowed the problem to occur. All of these factors are helpful in developing a corrective action plan.


понедельник, 31 октября 2016 г.

The Storytelling Wheel


On a recent transatlantic flight on BA, I watched two episodes of Community, a new TV show that I was frankly not familiar with (OK, so I haven’t been part of the show’s hip and enthusiastic online community, the enviable demographic that advertisers crave – at least not yet). In Community, Joel McHale plays a disbarred lawyer who attends a Community College, together with a ragtag group of diverse friends (one of them played by Chevy Chase). The show is hilarious. With October 31 just around the corner, one episode centered on a Halloween party gone terribly wrong, people turning into zombie, infecting each other, until a heroic act by one of the characters saves the day.
I decided to do some research, and found out that the show’s creator, Dan Harmon, uses a very specific method in his storytelling. He keeps drawing circles with eight slices. According to Harmon, a good screenplay (and a good story) follows a regular pattern:
1. A character is in a zone of comfort 
2. But they want something
3. They enter an unfamiliar situation
4. Adapt to it
5. Get what they want
6. Pay a heavy price for it
7. Then return to their familiar situation
8. Having changed.
Harmon calls these circles embryos – they contain all the elements necessary to make a story whole. He applies the concept to short side jokes, to the main story of an episode, and even to entire seasons.
It immediately struck me that this storytelling wheel works equally well if you tell a story in a business setting. Structuring a presentation or a final document to inform decision makers about the results of a project is nothing else but storytelling.
McKinsey uses the famous “Situation – Complication – Solution” approach to structure a story. In some instances, that SCS framework is very helpful. In other cases, I have found it to be quite broad, and people often struggle with it: There are often different ways to define the situation and complication. And even if you get the top level of the storyline right, then how do you flesh out in more detail the second level? Applying Dan Harmon’s storytelling wheel could represent an interesting alternative. Of course, it would have to slightly altered, for example:
1. A company / product / brand has been doing very well
2. But early successes have led to even bigger expectations
3. They are now faced with repeating their success in new customer segments / geographies
4. They have initially adapted well to it, and have managed to capture market share in these new areas
5. As a result, revenues are up significantly
6. But that was only achieved through a dilution of what the brand originally stood for. As a result, in a number of new areas, the revenue gains seem short lived
7. The company / brand refocuses on its core audience and core message
8. It has managed to expand somewhat beyond its original base, but has today a much better understanding of how to successfully do this.

воскресенье, 30 октября 2016 г.

Business Models


The concept of competing on business models seems to be en vogue right now. Witness HBR’s recent “How to Design a Winning Business Model” (one article in an entire edition dedicated to business models) or “Why Companies Should Have Open Business Models” by MIT Sloan Management Review. But surprisingly, there is no general, agreed upon classification of business models.
Another recent article (link) claims to remedy this. It offers a business model classification based on a four by four matrix, defining the types of assets a company sells and the rights it grants customers to use those assets.
The four asset types are: 
• Financial assets (cash, stocks, bonds, insurance policies, etc. – anything with a right to potential future cash flows);
• Physical assets (both durable and non-durable goods, food, etc.);
• Intangible assets (patents, copyrights, but also knowledge, goodwill and brand value);
• Human assets.
The four ways companies can manage assets to generate revenues are:
• Creators sell ownership of products they created by transforming or assembling raw materials, components, etc. 
• Distributors resell products that they did not substantially change.
• Landlords sell the right to use an asset for a specific period of time (e.g. a hotel room or rental car). The authors of the article included in this category also companies like Microsoft who sell licenses, i.e. limited rights to use their intellectual property. 
• Brokers receive a fee for matching buyers and sellers without taking ownership of a product.
The framework has a number of advantages in that it allows comparisons across a variety of industries. But there are certainly also drawbacks: Some of the classifications seem a bit arbitrary or farfetched: Where do you classify Citigroup’s large retail banking business, or CBS’s TV business, for example? The concepts of “financial landlord” or “IP landlord” seem to be a bit of a stretch for some of these businesses. Or where do you put a pharma company: a creator of physical goods, or an IP landlord? Maybe those are just classifications and labels that we’re not (yet) used to.
One thing that sticks out very quickly is that many companies cannot be easily classified into one bucket. A company like Disney, for example, is a landlord (renting access to physical assets like theme parks) but also a licensor of intellectual property. As a matter of fact, Disney’s business model has shifted dramatically over time, from over 65% “landlord” in 1984 to largely licensing intellectual property (15% of revenue in 1984, 63% in 2009).
The authors also looked at which business models are prevalent, and which ones are valued by the stock market more than others. They analyzed over 10,000 publicly traded companies in the US, classified their various businesses into the business model buckets described above, and created groups that then allowed them to track stock market performance. Some of their key findings:
• Only about 10 of the 16 potential squares in the four by four matrix have a significant number of companies and revenues, some business models are not really applicable or legal.
• 57% of the revenue of all the US listed firms is linked to “creators,” 28% to “landlords,” and 14% to “distributors.” Brokers only generate 1% of all revenues. 
• 81% of the revenue of all the US listed firms is linked to physical assets, 9% to financial assets. 
• Creators of physical assets, in particular a subgroup of “innovators” within this bucket, generated the biggest stock market returns.
I find this to be a very helpful framework for companies to think through their various businesses: Where are we today? How has our business changed over the past 10 years? How do we compare to traditional competitors and emerging players? Where do we have the competencies to adjust our business model?

пятница, 28 октября 2016 г.

Star Framework for Organizational Design


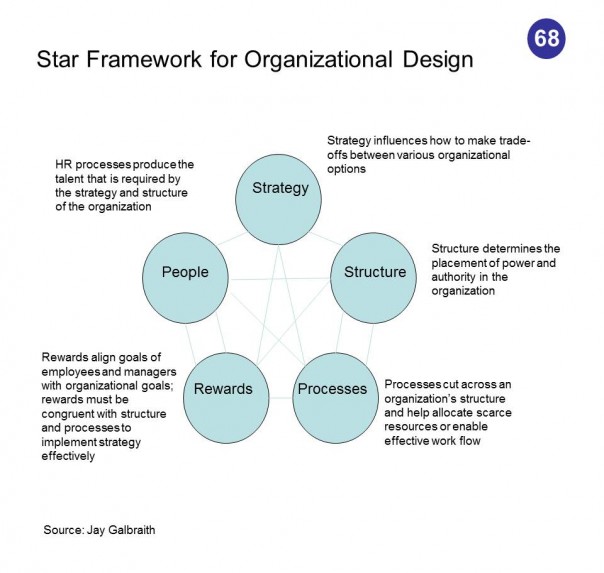
We recently worked on a proposal for an organizational design project, and I came across a number of interesting frameworks related to organizational design. Below is the first of those frameworks; I will follow-up with other examples in coming blog posts.

The Star framework, by Jay Galbraith, is a widely used design framework that lists five categories or factors that influence design decisions: Strategy, structure, processes, rewards and people. These factors affect how companies lay out an optimal organizational structure. There is a certain logical sequence between the five elements: Strategy drives structure, which in turn influences processes. All three of those then drive the implementation of rewards systems and people policies.
The five factors are helpful categories if you are, for example, drafting a questionnaire for the initial diagnostic of an organizational design project. They will help you make sure you understand the entire context in which design decisions will have to be made.
Jay Galbraith is a well known expert in organizational design, author of several books and former professor at MIT Sloan, Wharton and IMD. He has his own consulting practice and web site (link), which also provides interesting additional background information on the Star framework (link).

четверг, 27 октября 2016 г.

Five Basic Options for Organizational Structure

This blog post relates to a number of other recent posts on organizational design frameworks (e.g. Star FrameworkPeople Management PyramidPurpose, People, Process). The five basic options for organizational structure is one of those things where most people will say “of course, I knew this.” But I would bet that even experienced strategists may leave out one or two options. And a thorough review of what the options are, as well as a good understanding of their advantages and disadvantages, is always helpful if you embark on a project related to organizational design.

Functional Structure:
  • Advantages: Strong transfer of ideas and knowledge between employees of a certain background. Allows for greater scale and specialization.
  • Disadvantages: May create barrier between functions, “silos.” Can be overwhelming if there is a large number of products, channels or customers.
  • Well suited for the following strategic situations: Small firm, single product line, undifferentiated market, long product development cycle, etc.
Product Structure:
  • Advantages: Can be helpful to speed up the product development cycle and make product development very responsive to market needs.
  • Disadvantages: Risk of “reinventing the wheel” and duplicating resources. Loss of economies of scale. Can create confusion if customers buy from more than one division.
  • Well suited for the following strategic situations: A company sells multiple different product lines to distinct customers or customer segments. Short product development cycles.
Market or Customer Segment Structure:
  • Advantages: Intimate knowledge and understanding of a market segment can lead to competitive advantage. Can be particularly appropriate in service businesses.
  • Disadvantages: Same tendency to reinvent the wheel and duplicate resources. May be difficult to share common products or services.
  • Well suited for the following strategic situations: Products and services are unique to specific market/customer segments. Strong buyers, Customer knowledge provides a comnpetitive advantage.
Geographical Structure:
  • Advantages: Minimize costs of travel and distribution. Helpful if an organization needs to be located near a source of supply.
  • Disadvantages: Local “fiefdoms” may develop.
  • Well suited for the following strategic situations: Low value-to-transport cost ratio. Service delivery or support has to be on site. Perception of the organization as a local player provides a competitive advantage.
Process Structure:
  • Advantages: Allows for efficient definition and optimization of end-to-end processes (and accordingly tracking of clear metrics). Scale advantages, reduced working capital.
  • Disadvantages: Can create barriers and hand-offs between various process groups.
  • Well suited for the following strategic situations: Ability to fundamentally re-invent and optimize processes can provide a competitive advantage.

воскресенье, 16 октября 2016 г.

Complexity and Organizational Design


I’m staying with the theme of Organizational Design of my last few posts related to strategy frameworks. The issue of complexity is an important one in organizational design considerations. Often one of the goals of an organizational design project is to “simplify” structures and process so that people can do their jobs more effectively. But you can’t just eliminate all complexity and oversimplify everything. Complexity is a fact of life, and often the better question to ask is how it can be managed most effectively.
The framework below, based on a McKinsey Quarterly article (link), describes some of these trade-offs. It distinguishes between:
  • Institutional complexity, which is driven by the number of links to and interfaces with others within and outside the organization. The degree of institutional complexity is largely influenced by strategic choices and the external (e.g. regulatory) environment.
  • Individual complexity, which describes the way managers and employees perceived their jobs, whether or not they have a limited and easy, or extensive and complicated set of tasks to accomplish. The degree of individual complexity is driven by organizational and operational choices.
The two types of complexity are closely linked, and there is usually a significant trade-off. Companies tend to focus a lot of institutional complexity, but designing a simple org chart may result in employees jobs becoming more complex, as they have to deal with more interfaces.
To use an analogy: An airport is a system with low institutional complexity (only a few runways to use), but high degrees of individual complexity, since many critical decisions are concentrated in the hands of a few expert air traffic controllers. A road system is the opposite: High institutional complexity, with many roads and many different ways to get from A to B. But low individual complexity, with fairly simple decisions being made by a large, distributed group of drivers.
Key influencing factors:
Strategic choices:
  • Number of products and services
  • Number of geographies covered
  • Sources of competitive differentiation
External context:
  • Regulatory environment
  • Intensity of competition
  • Speed of competitive evolution and market changes
Organizational choices:
  • Structural design
  • Role definitions
  • Process refinement
  • Capabilities
  • Culture
Operational choices:
  • Complexity of the value chain (manufacturing, R&D, etc.)
  • Use of technology
The authors of the McKinsey article state that their research highlighted a few factors that are critical to managing individual complexity. Among them were issues like:
  • Effective organizational design at the individual level. A company may have a complex matrix structure, but still minimize organizational complexity at the individual level by making sure that activities are not redundant, that targets are clear, etc.
  • Well aligned processes. Not surprisingly, processes have a big impact on individual’s job complexity.
  • Strong capabilities: Building both basic management skills (functional skills, change management skills, etc.), but also the ability to deal effectively with ambiguity had a strong influence on people’s perceived individual job complexity.

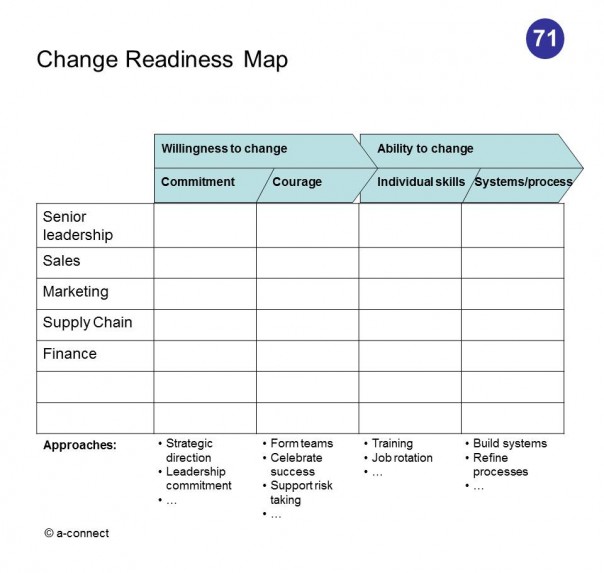
Change Readiness Map


This is a framework that we use quite regularly at a-connect. It’s a good diagnostic tool to engage a client in a discussion around how ready the broader organization (or a specific team) is for a significant change initiative.
The framework can be filled out for departments, or it can even be filled out for individual team members. It usually leads some valuable discussions on the topic of change readiness, and it is critical to have these discussions up front, rather than half way through a change effort.


четверг, 13 октября 2016 г.

Innovator’s Dilemma


Clayton Christensen’s book “The Innovator’s Dilemma (Harper, 2000) is certainly one of the most important business and strategy books from the last two decades. If there is one chart and concept that summarizes his theory on disruptive innovation, it’s the chart on the evolution of the disk drive industry.

Christensen spent years analyzing the industry in minute detail, looking at every aspect of the industry, from the performance of new products coming out to the demand of the various sectors of the computing industry. The disk drive industry had a number of specific advantages which made it a perfect case study for innovation: A global industry, with lots of data, relatively homogeneous product performance elements, and a dynamic of growth and innovation.

At the core of Christensen’s theory is that technological innovation has a way of outstripping demand. A set of suppliers who have perfected the art of the 14 inch disk technology, serve a set of customers in the mainframe computer industry. These suppliers do everything right: they serve their customers well, listen to their needs, continue to develop better and better products, etc. Along comes a new technology, such as the 8 inch disk technology. Originally, the leading suppliers don’t take this technology seriously. The new technology is far from achieving the same performance as the established technology, it cannot fulfill the needs of their core mainframe customers, and the emerging market for minicomputer is small and irrelevant in comparison to their main market.

But then two things happen: First, the minicomputer market grows rapidly, at the expense of the mainframe market. And secondly, the new technology rapidly gets better, and pretty soon is good enough to fulfill the demands and requirements of even the most demanding mainframe customers.

The chart which combines the technology evolution curves and the demand curves beautifully shows how these disruptive technologies catch up, and ultimately even surpass the older core markets.

Sales Assessment


Here is a somewhat complicated but very comprehensive model to assess the sales function of a company or business unit.
I can see this coming in very handy in a diagnostic phase of a project, allowing you to test various elements that affect sales performance: From the very broad knowledge and understanding of the market and overall sales targets, to very specific factors affecting the function itself (systems, people, processes, structures, competencies, product offering, instruments, etc.).
Note that a similar pictorial could probably also be used for various other functions, whether it’s finance, marketing, or supply chain.

понедельник, 26 сентября 2016 г.

Using ORG-MASTER for knowledge based organizational change


D. Kudryavtsev, L. Grigoriev, V. Kislova, A. Zablotsky
Abstract: Enterprises in growing markets with transitional economy nowadays encounter extreme necessity to change their structures and improve business processes. In order to support knowledge processes within organizational change initiative  enterprises can use business modeling tools. On one hand software vendors suggest many tools of this kind, but on the other hand growing markets with transitional economy determine quite special requirements for such tools. This article reveals these requirements, assess existing business modeling tools using these requirements and describes ORG-Master as a tool specially created  for support of process improvement initiatives in the growing markets with transitional economy. 
Keywords: Business information modeling, business modeling, knowledge process, organizational change, business process improvement, growing markets, transitional economy.

Introduction

ORG-Master is a business modeling software, which was initially created as a response to growing need for computer aid to consulting projects in the field of  organizational change and business transformation. In spite of the diversity of products for business modeling ORG-Master has certain advantages that can be revealed in solving certain tasks in certain environment.
Certain tasks include such organizational change components as business process improvement, business restructuring, quality management implementation and holistic improvement of management system. In the current article organizational development will be described by the example of business process improvement (BPI) initiative. 
Certain environment include growing markets with transitional economy (GMwTE) which determine specialties in organizational change initiatives. GMwTE include post-soviet countries (Russia, Ukraine, Belarus, Kazakhstan) and in the current article will be described by the example of Russia. In order to reveal these specialties Section 1 describes features of GMwTE from management point of view. Section 2 focuses on the flow of knowledge within BPI initiative and gives an ability to define requirements for business modeling tool at the GMwTE (section 3). Section 4 reveal imperfections of existing business modeling tools with respect to above-mentioned requirements and show the niche for ORG-Master. Section 5 explain the main concepts and consequent advantages of ORG-Master. Section 6 describes practical application of ORG-Master.

1. Business process improvement initiatives in the growing markets with transitional economy

The most important features of GMwTE from management point of view are:
1. Extremely high pace of change in market conditions and business environment
2. Low level of managerial culture
3. Predominance of informal methods of management
Quick changes and competition growth make companies to change in the same pace and the main objectives in the organizational change is to fit company structure with business needs and to implement client-oriented business processes that allow to achieve company goals. This results in the necessity to launch restructuring or BPI initiatives.
The main prerequisite for BPI initiative is transparent management at every level of organization. In this context transparency implies holistic knowledge describing What functions and processes are realized in the company, Who performs the functions, How the functions are performed, What for are the functions performed. While low level of managerial culture results in absence of clear knowledge in this field. As a results BPI initiative in the GMwTE usually involve a wide range of preliminary stages directed towards understanding of company “big picture” in order to make conceptual changes and define the processes for improvement or re-engineering.
The third feature of GMwTE — predominance of informal methods of management results in small amount of documents and business rules. Such a situation has its roots either in skeptical attitude to archaic and out-of-date formal documents at post-soviet enterprises or in quick growth of small start-ups. In some situations informal intuitive method of management brings fruits, but it is terminated by the scale of business and is one of the barriers in development of managerial culture. As a result BPI initiative in the GMwTE has an important objective – to  switch company from informal methods of management to formal procedures and business rules.

2. Knowledge process in the business process improvement initiative

BPI or restructuring initiatives deal with business organization knowledge.  Under business organization knowledge in the current article we will understand knowledge domain covering organizational goals, structure, processes, functions, rules, rights, authorities and relationships between this objects. Thus in order  to raise effectiveness of BPI initiative project team should support knowledge process in the domain of business organization knowledge. As described in [Strohmaier, 03a] knowledge infrastructure   is determined by the nature of knowledge process, which in turn can be understood through analysis of business processes covered by improvement initiative (figure 1).  

Figure 1: Business process and knowledge infrastructure relationship
The main constituents of improvement initiatives are organizational change processes - a subset of the whole system of business processes: 
  • business process analysis
  • business process improvement
  • organizational structure control
  • performance management
Business analysts (either internal, or external consultants) together with domain experts (head of departments and other managers) generate business organization knowledge, store and transfer it throughout the organization in these processes.
Application of business organization knowledge is distributed between all the other business processes — operating, management and support processes. Organizational roles of performers vary from workers to executives (top managers).
According to [Strohmaier, 03b] business organization knowledge can be visualized (figure 2).

Figure 2: Knowledge process in the business improvement initiative

The most important and influential feature of this process consists in different organizational roles involved in it and especially in the knowledge transfer process. During transfer process business analysts deliver their knowledge through the mediation of domain experts to personnel from different domains and organizational levels. As it was mentioned in [Section 1], one of the goals of BPI initiative in the GMwTE is to shift the priorities of management from informal methods to formal business rules. Thus the basis of knowledge transfer is formalized knowledge and the main factor of its successful internalization [see Nonaka, 03] by personnel is type of knowledge representation.
Type of knowledge representation depends on two specific knowledge processes generation on one hand and application on the other. While the way these processes are performed is determined by the involved organizational roles.
Business analysts have developed competencies in organizational management and system analysis. They have detailed understanding of business from different points of view and can operate with different objects and their relations (organizational units, functions, processes, goals etc).
Personnel from different domains and organizational levels have low competencies in organizational management see [Section 1]. They usually have only dim understanding of business from “organizational unit” point of view (answer for the question “who do what?”).
As a result business analysts primary use diagrams of different types and notations (IDEF0, UML, EPC) as a mean of knowledge representation. The other personnel use job descriptions, documents describing the functions of business units / departments and other regulating documents. In addition these regulating document for application usually prepared according to national, industrial or corporate standard. Namely these regulating documents solve one of the objectives of BPI initiative in the GMwTE - shift the priorities of management from informal methods to formal business rules see [Section 1].
Thus the necessity to facilitate communication between people speaking “different languages” predetermines important requirement for knowledge infrastructure.

3. Requirements to business modeling tool for GMwTE

For the current analysis we assume business modeling tool primary as a support system for knowledge generation and storage during BPI initiative.
Previous section described the necessity to have different types of knowledge representation during BPI initiative in the GMwTE. Assumption that the process of knowledge transfer do not change the type of knowledge representation imply the necessity to generate knowledge both in type of diagrams for analysis and regulating documents for application. This requirement for knowledge generation process determine the first requirement for business modeling tool:
1. Ability to represent knowledge in different types and formats.
Section 1 highlight the necessity of preliminary stages within BPI initiative in the GMwTE. For example, companies should define goals, composition of functions, change organizational structure, reassign responsibilities for function realization, reveal a list of business processes. This tasks can be done both in series and in parallel and include several analysts concentrating either on different tasks or on different levels of detail. Such a nature of BPI initiative determine the next requirement:
2. Ability to work both with a complex model (e.g. business process model) and with separate parts of this model (relate functions with organization roles, roles with infrastructure etc) using different views of enterprise.
Fast dynamic of the enterprise development is especially relevant for GMwTE and require constant improvements in business processes thus a model once created should be constantly up-dated. Model is a system of constituent objects and their relationships, but both objects and their relations changes constantly. This situation generate the third requirement:
3. Ability to reflect changes in objects and in their relationships throughout the whole model after changing any part of the model. In order to reveal a tool which satisfy all the abovementioned requirements an analysis of  the tools existent in the Russian market was carried out.

4. Analysis of existing business modeling tools in the Russian market

Although in some BPI initiatives knowledge is created and stored using typical office applications like MS Word or Excel or simple graphical packages like MS Visio this tools obviously do not satisfy requirements see [Section 3].
The main business modeling tools existent in the Russian market that are usually used for organizational development and BPI purposes are:
ARIS http://www.ids-scheer.com/
BPWin (AllFusion Modeling Suite) http://ca.com/
There are also some Russian products that contain either limited functionality or slight modifications of foregoing tools. Differences of these products are immaterial from chosen requirements point of view and as a result they appeared beyond the scope of our analysis.
There are also a broad range of CASE tools (e.g. Rational Rose) for corporate systems development. These tools include business process modeling, but their primary function is information architecture development and it determine their whole viewpoint for enterprise modeling. As a result they are nor convenient for organizational management and business process modeling, nor efficient. Thus they appeared beyond the scope of our analysis.
Here is generalized result of the analysis:
Requirement 1: Ability to represent knowledge in different types and formats.
ARIS: It include a broad library of object types and corresponding diagrams, but it has a very complicated mechanism for generating regulating documents. It is hard to customize necessary templates and consequently requires unique and expensive specialists
BPWin: It allow to generate IDEF0 diagrams, but it is also very hard to generate corresponding regulating documents in customary standards.
Requirement 2: Ability to work both with a complex model (e.g. business process model) and with separate parts of this model
ARIS: Satisfy. There are both a whole process model and separate constituent models.
BPWin: Dissatisfy. User works either with one object type (functions, roles) or with a whole model of business process (one type of composite diagram).
Requirement 3: Ability to reflect changes in objects and in their relationships throughout the whole model after changing any part of the model.
ARIS: Partially. Centralized library of modeling objects guarantee the reflection of changes in the particular object throughout the model (e.g. changing function name in one diagram cause changing this name in every diagram in the model), but changes in relationships between objects of different type do not appear automatically throughout all diagrams.
BPWin: Satisfy. All the objects stored in centralized library and are used in one type of diagram.
Thus presented tools do not completely satisfy suggested requirements. Besides this tools are quite expensive and requires extremely professional analytics to support business model.
There is a necessity for more effective business modeling tool for organizational development.

5. Main concepts and advantages of ORG-Master

Concepts and methodology
The main idea of ORG-Master consists in division of business modeling interface from model representation one. As a result each interface and type of knowledge representation is optimized for the solution of own tasks. This idea is contrary to an approach of ARIS and BPWin. In the foregoing products user input, editing and represent business model in the same knowledge representation type and format.
Division of interfaces in ORG-Master allow to represent knowledge both in different types (diagrams in different notations, reports, tables) and from different point of views.
On the other hand business model editing interface has its own type of knowledge representation based on two instruments: classifier (ontological models, see [Gavrilova, 00]) and matrix (table).
Classifier – hierarchical tree of particular objects (e.g. organizational roles, functions, material resources, documents etc), which can have different attributes: type, meaning, comments etc. In the process of building classifier objects become structured into a hierarchy/ tree – they receives relationships of AKO (“A Kind Of” [Gavrilova, 00]) type (figure 3).

Figure 3: Structuring informational objects
Matrix (table) – models that define relationships between objects of different classifiers in any combination of the later (figure 4). Relationships can also have different attributes (directions, type, name, index, meaning). 

А) Matrix as a relationship of objects from 2 classifiers
В) Tabular representation of a matrix of 2 classifiers
С) «Triple matrix»


Figure 4: Conceptual framework of matrix (table)

As any material object of any complexity (e.g. building) can be described using definite number of  2-dimensional (flat) schemes (e.g. design drawings) so and several matrix allow to receive multidimensional description of complex business system and make it both holistic and visible (see figure 5).  


Figure 5: Business process model as a system of classifiers and matrixes

ORG-Master advantages for end user
Foregoing concepts of ORG-Master provide the following features of this tool:
  • ability to generate multidimensional reports based on matrixes from business model with different level of detail, which allow to analyze company from many viewpoints for people at different levels of organizational hierarchy
  • ability to fine-tune knowledge representation reports, that allow to generate regulating reporting on the basis of business model for particular needs and customary standards
  • ability to generate visual diagrams of business processes that support business analysis
  • ability to decompose the whole business model into constituent separate submodels, which allow to divide complex BPI initiative into manageable tasks and solve problems in separate domains with adequate (pared-down) tool
  • all the objects and relationships from different submodels are integrated into centralized holistic model that allow to reflect changes in objects and in their relationships throughout the whole model after changing any part of the model
These features of ORG-Master satisfy requirements to business modeling tool for GMwTE and together with relatively low price and low training complexity characterize it as effective and efficient tool.
Among the relative disadvantages of this tool the most obvious is absence of quantitative analysis of business processes, but this feature is of low importance with respect to foregoing requirements.

6. Application of ORG-Master and practical results

ORG-Master has 6-year history of  application in the organizational change and BPI initiatives. There is a broad range of ORG-Master clients located in Russia, Ukraine. Size of ORG-Master clients vary from small companies to large holding structures (up to 10000 people).
The results of typical ORG-Master application in BPI initiatives include:
  • Business model which describe functions, organizational roles, goals and measures,  functions distribution among organizational roles and description of necessary business processes.
  • Regulating documents based on business model (job descriptions, procedures etc)
  • Diagrams of the necessary processes based on business model

Conclusions

Since organizational change and BPI initiatives become a life-style of every company it is useful to support such an activity with adequate tools for business modeling. But choice of  the tool is determined by the objectives of tool application and business environment. Current paper revealed specialties of BPI initiatives in the GMwTE and analyzed existing business modeling tools from that perspective. As a result of this analysis ORG-Master can be considered as an effective and efficient for knowledge process support during organizational change initiatives in the GMwTE.

Acknowledgements

The author of this paper is thankful to the advisor Dr. Prof. Tatiana Gavrilova (St. Petersburg State Polytechnic University) for her useful suggestions about content and destiny of this paper.

Bibliography

[Strohmaier, 03a] M. Strohmaier Designing Business Process Oriented Knowledge Infrastructures Proceedings der GI Workshopwoche, Workshop der Fachgruppe Wissensmanagement, Karlsruhe (2003)
[Strohmaier, 03b] M. Strohmaier A Business Process oriented Approach for the Identification and Support of organizational Knowledge Processes Proceedings der 4. Oldenburger Fachtagung Wissensmanagement, Oldenburg (2003)
[BIG, 96] BIG&Expert “Seven notes of management”, Moscow (1996)
[Nonaka, 95] Nonaka I., Takeuchi H.: “The knowledge creating company”; Oxford University Press (1995)
[Bukowitz, 99] Bukowitz W., Williams R.: “The knowledge management fieldbook”; Prentice hall, Pearson Education Limited (1999)
[APQC, 96] APQC’s International Benchmarking Clearinghouse Process Classification Framework www.apqc.org, (1996)
[Gorelik, 01] Gorelik S., “Business-engineering and management of organizational change”; (2001) http://www.bigс.ru/publications/bigspb/metodology/
[Gavrilova, 00] Gavrilova T., Horoschevsky V. “Knowledge bases of intellectual systems”; Piter / Saint-Petersburg (2000)
[Рубцов, 99] Рубцов С., Сравнительный анализ и выбор средств инструментальной поддержки организационного проектирования и реинжиниринга бизнес процессов http://or-rsv.narod.ru/Articles/Aris-IDEF.htm
[Репин, 01] Репин В. Сравнительный анализ нотаций. http://www.interface.ru/fset.asp?Url=/ca/an/danaris1.htm