четверг, 26 января 2017 г.

Decision Matrix: How to Make the Right Decision

Making the right decision is the biggest challenge that designers, managers, and innovators face especially when there can be more than one possible choice to select from and multiple factors that need to be evaluated to make the right decision. The Decision Matrix (also known as the Grid Analysis and Pugh Matrix Analysis) allows you to achieve this target by providing a measurable method that allows you to select a specific choice between many based evaluation values. For example, if you would like to buy a laptop and need to ensure you are selecting the right product among many based on a number of criteria that reflect the required features that meet your needs and daily usage. In this example and similar cases, the Decision Matrix can provide a quick and easily method to identify the right device to buy.
Previously, we explored the Decision Tree as a tool for decision-making, however, it needs time and knowledge to evaluate the weighted rates of each choice and doesn’t focus on the features associated with each choice. This later method is more suitable for complex decisions that involve multiple factors and stakeholders. The Decision Matrix is defined by the Business Directory as:
“a table used in evaluating possible alternatives to a course of action.”
The Decision Matrix depends on creating a weighted value for each choice and the sum of all these values enables users to compare the highest rated choices. The tool depends on creating a Decision Matrix table where the rows represent the criteria or the features that need to be evaluated, while the columns represent the different choices. You can download the Designorate Decision Matrix template in Excel spreadsheet format.

Creating the Decision Matrix

In this example, we will learn how to create a Decision Matrix to evaluate a number of innovative ideas and make a decision about which idea is viable, can be selected as a new project and will lead to a successful product for the company. In this example, we will name the ideas (Idea 1, 2,3…etc.), and set the evaluation criteria to the following:
  • Competency refers to how the new product will compete in the market
  • Cost refers to the cost required to adopt the new idea
  • Viability determines if the idea is applicable in real life
  • Desirability refers to how the consumer will accept and interact with the new idea
  • Alignment refers to how the idea aligns with the company production strategy

Step 1

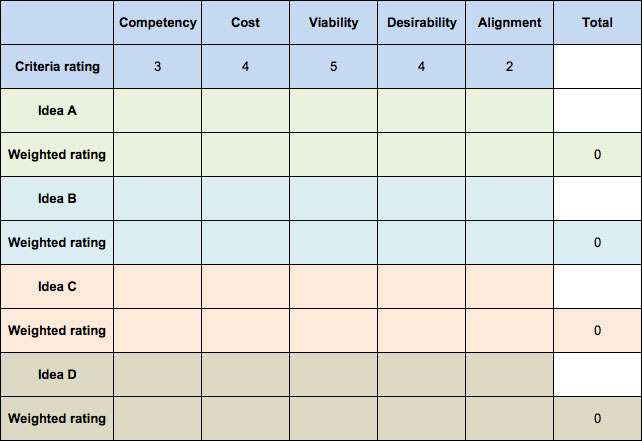
Create a table where the rows represent the evaluation criteria above and the columns include the choices. In this example, the choices will be Idea A, B, C, and D.
Establish a rating scale for each criterion. The rating should range from 1= less importance and 5= high importance. Then, add these rates under each criterion in the table. As shown in the figure below, the competency has given a rating of 3, cost= 4, viability=5, desirability= 4, and alignment=2.

Added rating for criteria

Step 2

Now, you need to rate each idea based on each criterion. The rating is again from 1 to 5. The 1 means that the idea is least qualified based on the chosen criteria. 5 means that the idea is very qualified in terms of the selected criteria. For example the Idea A was rated 1 based on the competency, which means that the idea is less desirable in terms of market competency.

Add rating for each option (Idea)

Step 3

Now, we need to calculate the weighted score for each idea based on each criterion. The weighted value is a result of the multiplication of the criteria rank and the idea rank as demonstrated below:
Idea A weight = criteria rank X idea score
The total weighted score should be written in the last column as seen in the figure below. Then, the ideas are prioritized from the highest score to the lowest score. In this example, Idea A presents a good opportunity for the company to achieve innovation in the market. Based on the final result, Idea B is more likely to achieve success in the market, while Idea C is the least idea to achieve market success.

Calculate the weighted rate for each option (idea)
In some situations, the final results may vary from the expected choices. In this case, the rating for each criterion should be reviewed and revised as necessary.
The Decision Matrix presents an easy and measurable method to take decisions based on the rating and scoring of different criteria and compare the different choices based on these criteria. The above template allows you to automatically calculate the weighted rank of each idea and decide which idea to select. This template is based on an Excel spreadsheet document. The tool depends more on practicing it. It may take some time at the beginning to adopt it as part of your daily habits, then it should become easy to use in different situations.

Prioritization Matrix Is Made Easier with a Template

The prioritization matrix is a great tool, but it does not seem to be used as much as it could be. The reason is probably because it takes a lot of time to do manually, and it can be confusing. To make the tool more usable, this article is accompanied by an automated template in the form of an Excel spreadsheet
The prioritization matrix, also know as the criteria matrix, is used to compare choices relative to criteria like price, service, ease of use and almost any other factor desired. 
While this tool can be used effectively by an individual, it is great for helping Six Sigma project teams with decision making. The “seven management and planning tools” was taught to many by Michael Brassard, who wrote The Memory Jogger II in 1994. In his book, he said the prioritization matrix is said to: 
  • Quickly surface basic disagreements so that they may be resolved up front.
  • Force a team to focus on the best things to do, not everything they could do, dramatically increasing the chances for implementation success.
  • Limit hidden agendas by surfacing the criteria as a necessary part of the process.
  • Increase the chance of follow-through because consensus is sought at each step in the process (from criteria to conclusions).
  • Reduce the chances of selecting someone’s pet project.
Within the Six Sigma methodology, there are several places where this tool is just made for the job – from selecting projects, to determining which measurement instrument to use, to control the new processes. This tool can be useful in resolving the tradeoffs necessary in product and service design like those indicated in the “roof” of the quality function deployment house of quality. The tool is used extensively in making business decisions and in facilitating teams. (The author has even used it in choosing a house – comparing prices, numbers of rooms, garage sizes and locations.) 
On the prioritization matrix Excel spreadsheet, up to nine criteria can be entered, but the number of criteria can be expanded if necessary. Importantly, the spreadsheet allows weights to be assigned to the criteria since not all criteria are of equal importance. 
The example used in the explanation of the matrix is from on a fictitious project to evaluate and choose knowledge management software. Here is a step-by-step outline of how the matrix is used: 
Step 1: Open the Excel spreadsheet. Enter each of the criteria for judging a product or process on a separate line in the first column of initial gray box titled “criteria weight” (Figure 1), replacing existing criteria (or criteria #) with the new criteria. The criteria entered automatically will be placed in all the following comparison matrices, the summary matrix and the selection graph.


Step 2: Compare the first criteria to each of the others by choosing the most appropriate value from the values chart (Figure 2) and putting it in the matrix. (Note: Clicking on the “values” window will allow it to be dragged out of the way and repositioned to any location on the spreadsheet. Teams need this reference, particularly at first, to remind them of the evaluation description and its value.) 
In the example, the first comparison is between “little to no customization necessary” and “service costs.” The number 0.20 was entered, which indicates the team’s evaluation was that little need for customization to be of “less value” than service costs. The matrix automatically enters the reciprocal of less value, which obviously is “more value,” or the number 5.00, in the appropriate place on the service costs line. 
Continue the process by comparing the first criteria with each other criteria on the list. Then repeat the process for the criteria on the second, third, fourth, etc. lines, comparing them to the criteria not yet compared. Only put a value in the solid gray areas; the reciprocal value will be calculated and inserted in the light gray areas automatically. 
Step 3: Enter each of the products or processes being evaluated on a separate line in the first column of the second gray box (Figure 3). The entries automatically will be placed in all the other comparison matrices, the summary matrix and the summary graph.

Step 4: Now, compare the choices to one another considering each criteria. The team should use the same values that were used to compare the criteria, or characteristics, one to another. In the example, the “MicroLog” product was rated by the team as “much more value” (10.00) than the “EMG” product in terms of little need for customization. Consequently the reciprocal value, or 0.10, was automatically entered for the EMG offering. Again, the team need only put a value in the solid gray areas; the reciprocal values automatically will be calculated for the light gray areas. 
Step 5: After all the entries are made, results can be read in the summary matrix (Figure 4) and the selection graph (Figure 5).


Системы мышления и поведения у менеджера


Четыре основных направления мышления.

Мотивация
Результат
Команда
Система
Мотивация 
Ориентация на других людей, много времени уделяется мотивации, развитию персонала.
Основной вопрос: "Как найти подход к человека, чтобы достичь цель?"

Команда
Много времени уделяют созданию командного духа.
Основной вопрос: "Как создать команду единомышленников, чтобы достичь цель?"

Результат
Основная цель - достичь результат. 
Основной вопрос: "Что я хочу достичь?"

Система
Создание "конвейера" в работе.
Основной вопрос: "Как построить высокоэффективную систему работы предприятия, с помощью которой можно достичь цель?"

The top 20 drugs in 2020--worldwide sales

Forecasting drug sales is a tricky business; just ask any biopharma CEO who has overpromised and underdelivered. The people who make it their business know that very well, and they update their numbers with every big shift in the market and every surprise result from a key clinical trial.

These days, the variables are many, with some more variable than others. Biosimilars are coming in the U.S., with several big products targeted in the next few years. We know that's going to hit the original biologics; we aren't sure how much. Payers are increasingly pressing for discounts, particularly in highly competitive fields like hepatitis C drugs, respiratory meds and diabetes treatments. How much will those discounts grow, and how much might the pressure spread beyond those areas? How might new approaches to cancer-drug reimbursement--such as Express Scripts' ($ESRX) indication-specific project--affect sales of those meds?

Some hotly anticipated outcomes trials could raise the prospects for some drugs, just as a cardiovascular trial did for Eli Lilly and Boehringer Ingelheim's Jardiance last year. Will they deliver the goods for Amgen ($AMGN), Sanofi ($SNY) and Regeneron's ($REGN) PCSK9 drugs? Novo Nordisk's ($NVO) Victoza?

Will new safety concerns pop up for blockbuster multiple sclerosis meds as they did for Biogen's ($BIIB) Tecfidera last year?

We'll be looking out for the answers. But for this moment in time, we present the 20 drugs expected to top the worldwide ranks in 2020, as analyzed by the market research and consulting firm EvaluatePharma. They include some old standbys--Roche's ($RHHBY) Herceptin and Avastin, Pfizer ($PFE) and Amgen's Enbrel, Merck & Co.'s ($MRK) Januvia--and some brand-new entrants, such as Bristol-Myers Squibb's ($BMY) immuno-oncology treatment Opdivo, who hits the list in third place. They range from 2020 sales at the high end of $15.92 billion--AbbVie's ($ABBV) Humira--to $4.04 billion at the low end, forecasted for another newcomer, ViiV Healthcare's HIV fighter Triumeq.

Meanwhile, three not-so-lucky contenders fell out of the top 20 just since last summer, when EvaluatePharma published its annual ranking; you can get more info on them by clicking through. Xarelto, Bayer and Johnson & Johnson's ($JNJ) blockbuster anticoagulant, lost ground after its head-to-head competitor Eliquis revved up its sales for Pfizer and BMS. For AbbVie and Johnson & Johnson's Imbruvica, a hot-selling leukemia and lymphoma med, growth depends on the results of clinical trials in new indications, always an uncertain proposition. And Lantus, Sanofi's long-dominant basal insulin, faces biosimilar competition in the U.S. by the end of 2016, not to mention some other branded competitors, including the French drugmaker's own Toujeo.

Do you have thoughts about 2020's top 20? Will the list change much as that date approaches? As always, let us know.

The top 20 drugs in 2020--worldwide sales


1. Humira


AbbVie and Eisai
Rheumatoid Arthritis and other inflammatory conditions
2015 sales: $14 billion
2020 projection: $15.92 billion
Humira, currently the world's best-selling drug, will still be holding onto that title in 2020, EvaluatePharma predicts. Between now and then, though, analysts expect it to hit its peak and then begin its decline. The key questions: When, exactly, will that decline begin? And how fast will it happen?
The answers depend on which analysts you ask. It's no secret that biosimilars are on the way; India's Zydus Cadila already has one on the market in India, and plenty of other knockoff makers wouldn't mind snagging a piece of the med's hefty sales haul. In June, biosimilar industry members, payers, regulators, lawyers and healthcare investors who participated in a survey conducted by Bloomberg Intelligence predicted Humira biosims would be the most successful copycat biologics launched in the U.S. and Europe.
AbbVie, though, has touted its robust stateside IP protection, which it claims will keep rivals off the U.S. market until 2020. As Suntrust analyst John Boris sees it, the company will have time to extract "maximum value" from the franchise through volume gains, pricing, label expansion, a new formulation, etc.--all "well before" biosimilars hit.
Citi analyst Andrew Baum sees things differently, though. Humira sales will take a hit beginning in 2018, he predicted in a February note to clients, with the med's revenues declining from $16 billion at their peak in 2017 to $6 billion in 2022.
AbbVie is trying to soften the blow through M&A and new products. The company in 2014 shelled out $21 billion for Pharmacyclics to get its hands on the drugmaker's share of blood cancer powerhouse Imbruvica. And analysts are predicting big things from AbbVie's new hep C med Viekira Pak, which could potentially break the blockbuster barrier.
New indications could also help Humira on the rocky road ahead. AbbVie recently snagged European approval for a new formulation of the drug to reduce pain from injections. In September 2015, the company scored a win after the FDA approved Humira to treat a rare inflammatory skin disease--an indication with peak-year sales potential of $1 billion annually, Scott Brun, AbbVie's VP of pharmaceutical development, told FiercePharma at the time of the approval.
AbbVie plans to keep the regulatory wheel churning for Humira, he added, planning to submit applications in the U.S. and EU in 2015 for Humira to treat inflammatory eye diseases. Those indications, along with 9 other approved indications in the U.S., make the drug "well-positioned to face the challenges of potential new entrants," Brun said. --Carly Helfand

2. Revlimid