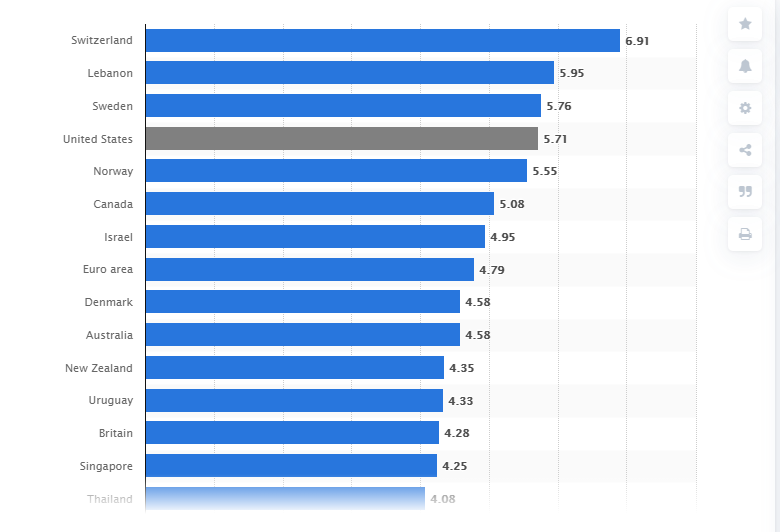
Global price of a Big Mac as of July 2020, by country(in U.S. dollars) - https://www.statista.com/
Many people have
tried a famous Big Mac at McDonald’s fast food restaurants at least once in
their lives (even though it’s not quite healthy food).
This hamburger is
probably the most famous in the product line of the American fast food
industry. However, few people know that it gave rise to the so-called Big Mac
Index, which is used to compare the value of currencies of different countries.
What is the Big
Mac Index?
The Big Mac Index is the price
of the burger in various countries that are converted to one currency (such as
the US dollar) and used to measure purchasing power parity.
It all started in
1986 when The Economist magazine decided to estimate the currencies’ value by
countries based on the prices of Big Mac at McDonald’s fast-food restaurants.
Thus, The
Economist introduced a simple indicator of the fundamental value of currencies
globally.
Why exactly was
the Big Mac taken as an indicator?
The reason is very simple. Big Mac is the most
well-known product in McDonalds’ fast-food chain. Besides, the same ingredients
are used for Big Mac in any country: meat, bread, cheese, lettuce, onions, etc.
Therefore, The Economist experts use Big Mac alone instead of determining the
cost of a consumer basket (more complex method) for each country.
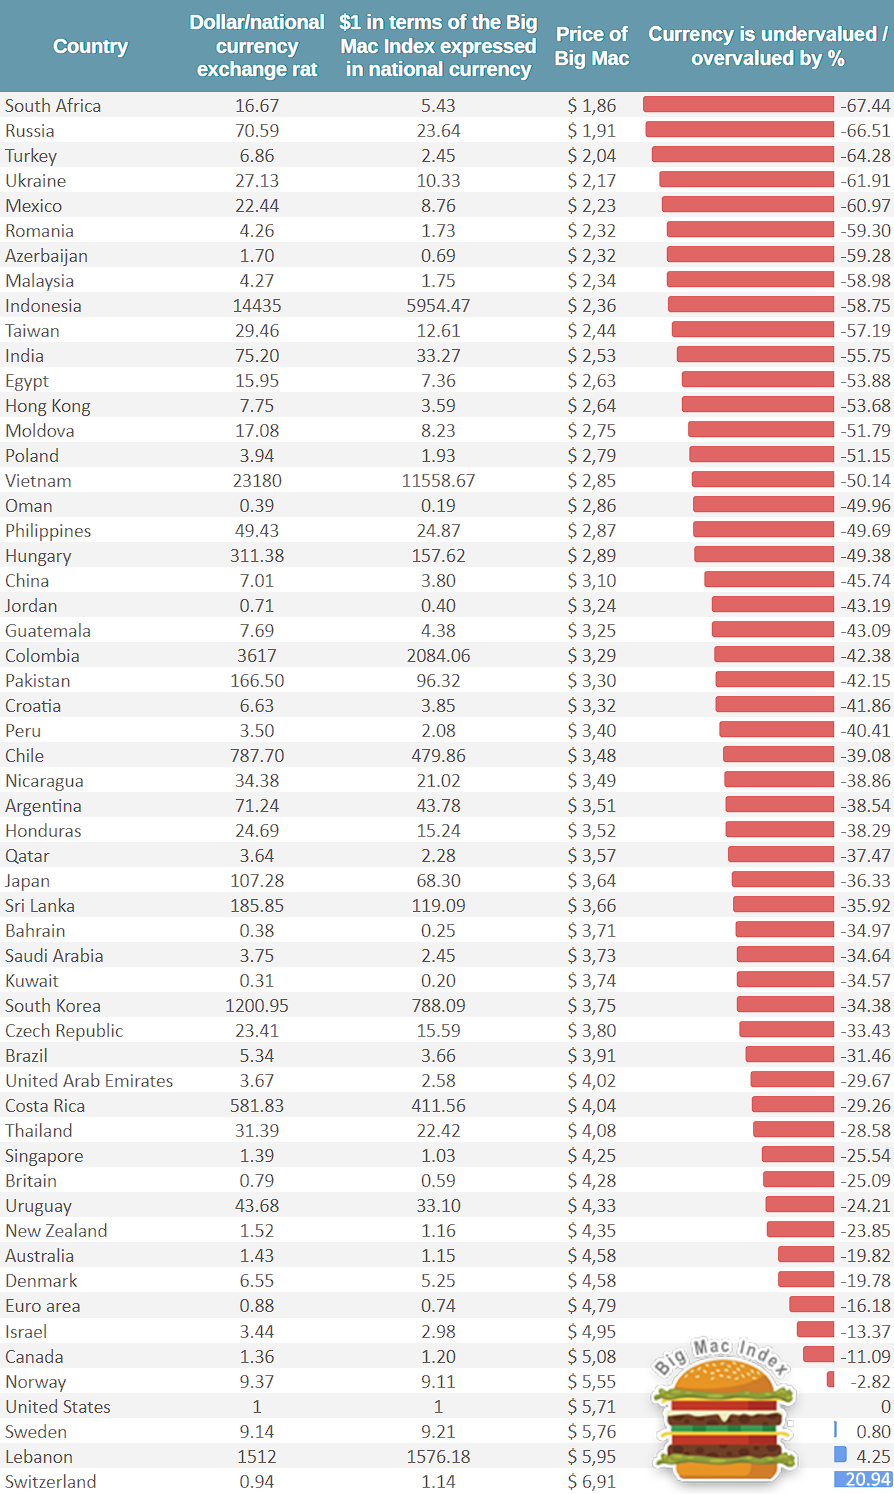
Big Mac Index Table as of Q2
2020
The most relevant
Big Mac Index so far (as of July 2020) is presented in the table below.

Let's analyze these data a bit.
The South African Rand exchange rate expressed in terms of the Big Mac Index in 2020 is 5.43 rand per dollar.
Considering that the current market rate of the South African currency is about 16.67 rand, rather than 5.43 per US dollar, the rand is undervalued by approximately 67.44%.
Thus, the South African Rand is the world’s most undervalued (cheapest) currency according to the Big Mac Index.
In 2019, the Russian ruble was the most undervalued (by 64.5%) currency worldwide.
Now, Big Mac costs $1.91 in Russia. While the price of the burger in the United States is $5.71, the Russian currency exchange rate is 23.64 ruble per dollar in terms of the Big Mac Index.
However, the ruble is much cheaper in Forex – about 70.59 ruble per US dollar (as of July 2020). Therefore, we can conclude that the Russian currency is undervalued by the market by almost 66.51%.
In the list of world’s most undervalued currencies, Russian ruble and the south african rand are accompanied by the turkish lira (undervalued by 64.28%), the ukrainian hryvnia (by 61.28%), and the mexican peso (by 60.97%). Notably, the currencies of India, Pakistan, Philippines, and other low-income countries are not in the top five most undervalued currencies in 2020.
As for the most highly valued currencies, the statistics by countries shows that the world’s most overvalued (expensive) currency is the Swiss franc.Considering that Big Mac costs 6.91 francs in Switzerland, the USD/CHF rate expressed in the Big Mac Index terms should be 1.14 francs per dollar. However, the value of this pair is currently quoted around 0.94 in Forex, which makes the Swiss currency overvalued by the market by 20.94%.
Lebanese pound overvalued by the market by 4.25%. Swedish krona overvalued by the market by 0.80%. Besides the lebanese pound and swedish krona, The Economist’s experts identified other overvalued currency in their previous rating – Norwegian krone. However, today, things are not the same for these currency as well – they have also become undervalued, although not as much as the rand and ruble.
According to the Big Mac Index authors, Euro is also undervalued by the market. The average price of Big Mac in the Eurozone is 4.79 euros, meaning the currency is undervalued by 16.18%.
Notably, according to the Big Mac Index, all major currency pairs, except the Swiss franc, Swedish krona and Lebanese pound, are undervalued against the US dollar.
https://bit.ly/32gYe4E
The Big Mac index
Global exchange rates, to go
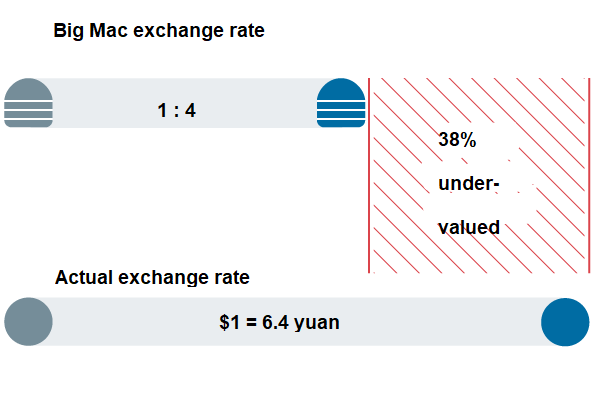
THE Big Mac index was invented by The Economist in 1986 as a lighthearted guide to whether currencies are at their “correct” level. It is based on the theory of purchasing-power parity (PPP), the notion that in the long run exchange rates should move towards the rate that would equalise the prices of an identical basket of goods and services (in this case, a burger) in any two countries. For example, the average price of a Big Mac in America in July 2016 was $5.04; in China it was only $2.79 at market exchange rates. So the "raw" Big Mac index says that the yuan was undervalued by 45% at that time.
Burgernomics was never intended as a precise gauge of currency misalignment, merely a tool to make exchange-rate theory more digestible. Yet the Big Mac index has become a global standard, included in several economic textbooks and the subject of at least 20 academic studies. For those who take their fast food more seriously, we have also calculated a gourmet version of the index.
This adjusted index addresses the criticism that you would expect average burger prices to be cheaper in poor countries than in rich ones because labour costs are lower. PPP signals where exchange rates should be heading in the long run, as a country like China gets richer, but it says little about today's equilibrium rate. The relationship between prices and GDP per person may be a better guide to the current fair value of a currency. The adjusted index uses the “line of best fit” between Big Mac prices and GDP per person for 48 countries (plus the euro area). The difference between the price predicted by the red line for each country, given its income per person, and its actual price gives a supersized measure of currency under- and over-valuation.
Raw index
Burgernomics was never intended as a precise gauge of currency misalignment, merely a tool to make exchange-rate theory more digestible. Yet the Big Mac index has become a global standard, included in several economic textbooks and the subject of at least 20 academic studies. For those who take their fast food more seriously, we have also calculated a gourmet version of the index.
This adjusted index addresses the criticism that you would expect average burger prices to be cheaper in poor countries than in rich ones because labour costs are lower. PPP signals where exchange rates should be heading in the long run, as a country like China gets richer, but it says little about today's equilibrium rate. The relationship between prices and GDP per person may be a better guide to the current fair value of a currency. The adjusted index uses the “line of best fit” between Big Mac prices and GDP per person for 48 countries (plus the euro area). The difference between the price predicted by the red line for each country, given its income per person, and its actual price gives a supersized measure of currency under- and over-valuation.
How it works
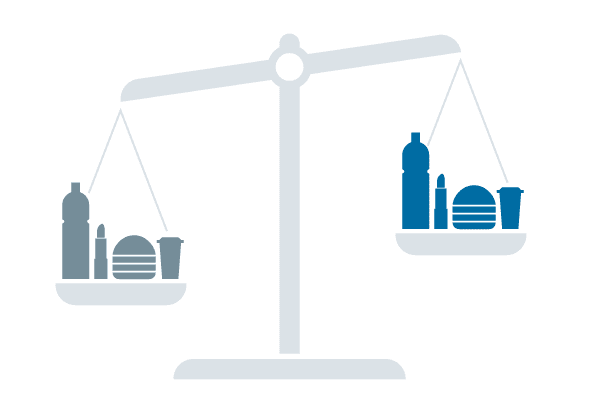
Differences in local prices – in our case, for Big Macs – can suggest what the exchange rate should be

Using burgernomics, we can estimate how much one currency is under- or over-valued relative to another


Source data
Our source data are from several places. Big Mac prices are from McDonald’s directly and from reporting around the world; exchange rates are from Thomson Reuters; GDP and population data used to calculate the euro area averages are from Eurostat and GDP per person data are from the IMF World Economic Outlook reports.


