
Our compilation of the latest social media statistics of consumer adoption and usage of social networking platforms
Social networks have transformed marketing and, as this post shows, their popularity is still growing in our latest global social media statistics research summary for 2024.
Networks vary in popularity with different demographics and they're still evolving. Research by Global WebIndex that we reference in this article shows that globally,
62.3% of the world's population uses social media. The average daily usage is 2 hours and 23 minutes (April 2024).
We'll keep this post updated during 2024 as the latest statistics are published drawing on our recommended top 10 digital marketing statistics sources. We'll be pointing to new data on the popularity of social media from Global Web Index (worldwide), Pew Internet Surveys (US) and OfCom (UK), and, most recently, the Datareportal January 2024 global overview, with the January review expected in the next few weeks.
This post will apply the latest reports to our answers in 7 key areas crucial to understanding consumer use of social networks:
- Q1. What is the overall popularity of social media compared to internet use globally?
- Q2. Which are the most popular social networks by demographics (age and gender)?
- Q3. Which are the fastest-growing social networks?
- Q4. How do social users interact with brands when selecting products and services?
- Q5. What are the different engagement metrics based on consumer behavior when using social media?
- Q6. How do consumers interact with different post formats in social media?
- Q7. What are the most popular times for consumers to use social media suggesting the best times to post?
Now more than ever, marketers need to make smart decisions when planning their digital distribution channels. So reviewing the latest social media diffusion and usage stats is a crucial part of any company's digital marketing strategy.
Q1. What is the overall popularity of social media compared to internet use globally?
Datareportal regularly updates its global compendium of social media statistics, which we recommend as it gives some great insights into the world of social media. It's a great download for including slides for your presentations. Note that their data is compiled from other sources of which the Global Web Index panel is the best source, although only available to paid subscribers. If you're researching social network adoption, it's worth checking out GWI's top 10 2023 social media statistics and their free annual report of social media trends.
How many people use social media?
According to the Datareportal January April global overview, we can see that social media growth has continued to increase:
- More than half of the world now uses social media (62.6%)
- 5.07 billion people around the world now use social media, 259 million new users have come online within the last year.
- The average daily time spent using social media is 2h 20m.
The full report from Datareportal contains insights collated from different data providers across 200+ slides. It provides country-specific data for the vast majority of the world, so you might want to check out the slides of the countries in your core markets to get a better idea of the current state of social in the areas you operate. In this post, we focus on the social media data which starts at slide 205 in the report.
This chart, by Datareportal, summarises the importance and growth of social media today.
Although the average daily time spent on social has slightly decreased (4 minutes), the growth of adoption remains high. Currently, 93.3% of internet users are using social media, and the gender split is fairly balanced, with slightly more male identities than female identities.

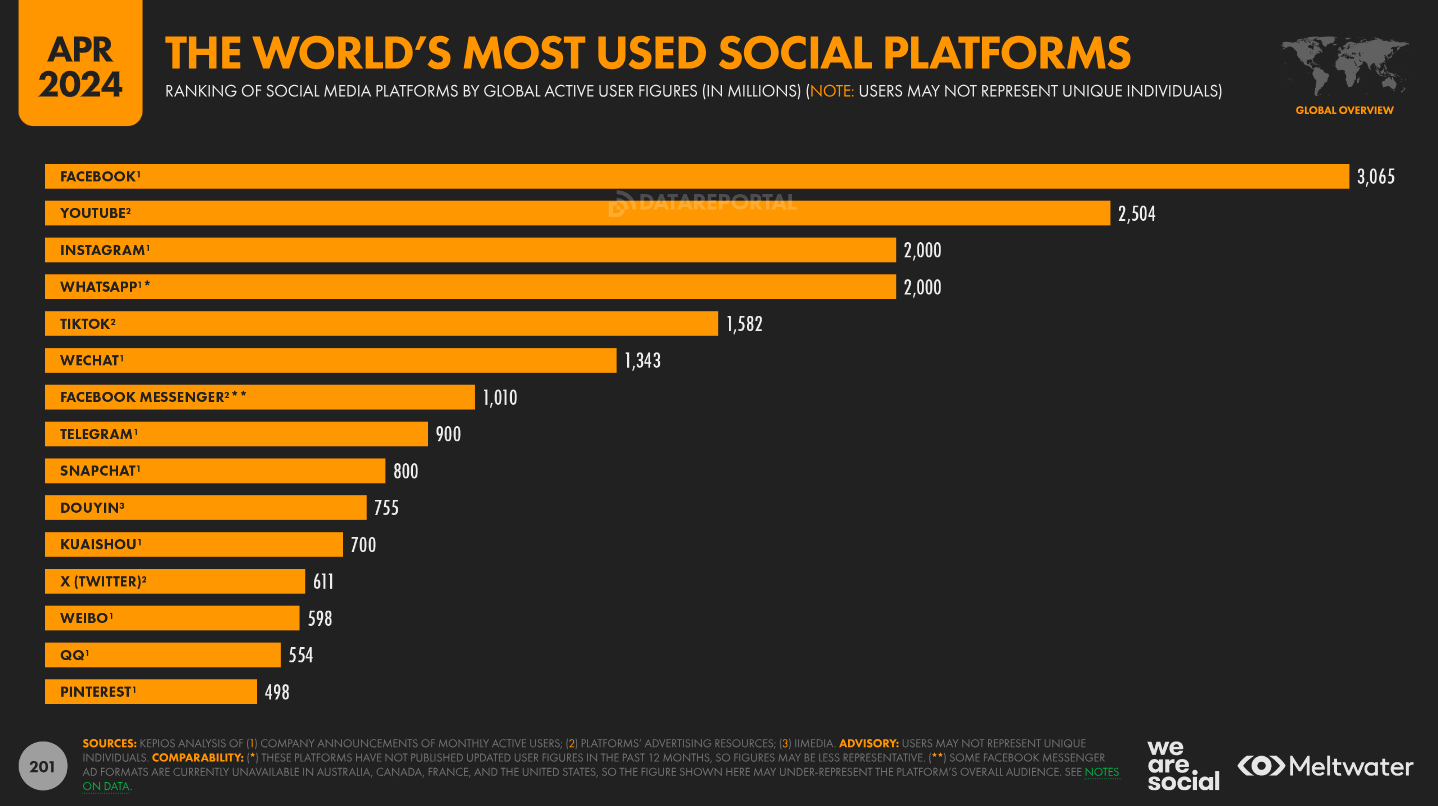
Q2. Which are the most popular social networks by demographics (age and gender)?
The best source for getting stats on the biggest social media platforms is direct from company statements and earning announcements.
Notably, of the top 4 social media platforms, 3 are owned by Meta. Facebook is the most-used platform in total - but as marketers, we know it's crucial to consider different trends of usage for different demographics, as we'll see below.

So, what does this mean for your social media marketing strategy?
Clearly, there are lots of opportunities to reach, interact with, convert, and engage social media users. Savvy marketers use social media across their marketing funnel, to influence journeys from product discovery, through to first purchases, loyalty, and advocacy.
Our RACE Framework has a data-driven structure that marketers can use to plan their own strategies.
Popularity of social networks and instant messengers in the UK for different demographics
This recent data from Comscore focused on the UK for Gen Z, Milennial and Gen X groups shows the wide variation in usage of social apps in the UK. In the younger age group Reddit and Discord are surprisingly important, in part because of Gaming. Facebook remains dominant in older age groups.

United States Social network popularity
The Pew Research Center news usage research is a very strong recent source showing US social media statistics trends in usage for news. Interestingly, nearly half of those surveyed used social media to get news often or sometimes.


Q3. Which are the fast-growing social networks?
Every marketer has limited time for social media marketing, so which fastest-growing social network should you focus your efforts on?
HubSpot has a good summary of these based on its own consumer survey - see Fastest growing US social platforms 2023 which features less well known, but growing social networks such as BeReal and Twitch.

A summary of global social media growth
The number of social media users globally grew from 4.72 billion in January 2023 to 5.04 billion in January 2024. This accounts for a 8% growth of +320 million users YOY. With more growth predicted over the rest of the year...
Social media vs internet users: opportunities for growth
94.2% of internet users have social media identities today.
Social media platforms today are evolving and developing to meet an ever-wider variety of consumer wants and needs. Surely the value that social media usage can add to consumers' lives is more evident than ever before - social media marketers can tap into that.
2024 analysis of regional use of social media shows the wide variation of social media penetration:
- 75% in Eastern Asia
- 71% in North America
- 68% in Southern America
- 79-80% in both Northern and Western Europe.
- This falls to 16% in Western Africa, and 10% in Middle and Eastern Africa.


Q4. How do social users interact with brands when selecting products and services?
One of the challenges of social media marketing is that by its nature, social media are peer-to-peer, involving conversations between friends, families and colleagues. Given this, brands must be sensitive to how they use social media.
Insight from GWI shows the important role that social media plays in influencing brand discovery and in encouraging purchase. This insight shows the relative importance of ads, recommendations and updates to business social media pages in brand discovery.


Platform-specific social media marketing planning
Our new Organic Social Media Learning Path modules are dedicated to helping marketers optimize their organic Instagram marketing with a strategic approach, integrated across the marketing funnel.
Our bite-sized modules contain tools and templates designed to help you address the systematic issue of businesses using social media platforms to create standalone posts rather than planning a strategy.
Our Social Media Learning Path has modules with dedicated help for:
- LinkedIn organic marketing
- Instagram organic marketing
- Facebook organic marketing
- Tiktok organic marketing

Q5. What are the best benchmarks for different platforms' engagement rates?
Social media statistics benchmarking tool Rival IQ produces these useful sector-by-sector benchmarks of social media engagement metrics including:
- Posts per day
- Posts per week
- Engagement rate
- Top hashtags by engagement rate
These include useful sector benchmarks for Facebook, Instagram, and Twitter you can compare against. Here is a sample of the insights from their 2022 report.
Facebook engagement rates
The 2021 median average engagement rate per post (by follower) on Facebook is 0.064%, across all industries. Sports Teams see the highest engagement, achieving an average of 0.27%, followed by Influencers with 0.23% and Higher Education with 0.15%.
At the lower end of the spectrum, Health & Beauty, and Tech & Software receive an average 0.02% engagement rate.

Instagram engagement rates
Engagement rates are significantly higher on Instagram compared to Facebook. As you can see the 2021 average median engagement rate per post (by follower) is more than 10x higher, despite engagement on Instagram dropping approx 30% between 2020-21.

Q6. How do consumers interact with different post formats in social media?
Marketers know intuitively that the right type of visuals and videos are more effective in gaining engagement.
This is supported by observed interaction rates. According to LinkedIn, Images typically result in a 2x higher comment rate and Video gets 5x more engagement on LinkedIn, Live Video gets 24x more.
This is also supported by this data from this Social Bakers social media trends report:

Videos longer than a minute achieved the highest median interactions and median reach on Facebook, according to Socialbakers data.
In fact, for both reach and interactions, there was a correlation that showed the longer a video was, the further it reached and the more interactions it received.
Socialbakers’ metrics for video length are very short (less than 11.882 seconds), short (more than 11.882 and less than 24.362 seconds), medium (more than 24.362 and less than 61.248 seconds), long (more than 61.248 seconds and less than five minutes), and very long (more than five minutes).

As you can see, different platforms offer different opportunities for capturing different audiences. The trick is finding the right techniques to that to your channel goals.
If you're looking for one simple reference guide which contains all the social media channel updates in an easy-to-track format, look no further than our digital media updates tracker, which is updated quarterly, to make sure our Business Members never miss a trick.
Q7. What are the most popular times for consumers to use social media suggesting the best times to post?
Testing different frequencies of updates and timing is another aspect of social media optimization based on consumer behaviour.
Each network tends to have a ‘sweet spot’ for frequency based on its algorithms. It used to be beneficial to post several times a day on Facebook for many brands, but with decreased organic reach, a single update tends to be more effective. We find a higher frequency on LinkedIn or Twitter tends to be more effective.
Sprout Social's 2022 social media strategy builder compares the best times to post on social media. Compare these to your patterns of posting and consider how you could post differently.
Each network tends to have a ‘sweet spot’ for frequency based on their algorithm and the most common times for consumer usage. It used to be beneficial to post several times a day on Facebook for many brands, but with decreased organic reach, a single update tends to be more effective.
We find a higher frequency on LinkedIn or Twitter tends to be more effective. The results from Instagram and Facebook show a clear preference for around midweek at midday, so you should consider this when scheduling your post updates.

https://tinyurl.com/mpm4jsh4


